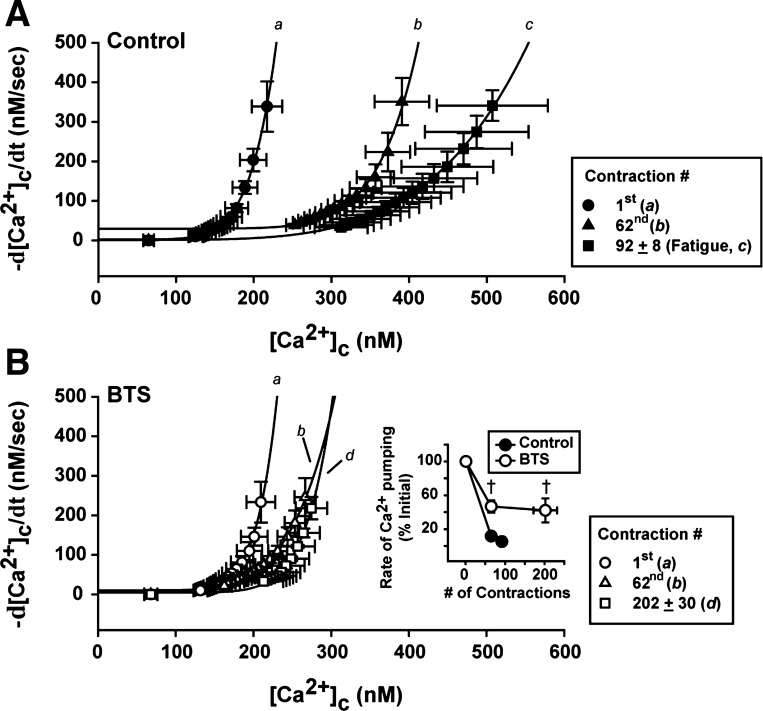
Fig. 4.
Analysis of SR Ca2+ pumping at different time points of the contractile bout in presence (control; A) and absence of cross-bridge cycling (BTS; B). The tail of [Ca2+]c decay trace recordings (as shown in Fig. 3, A and B) were fitted with a sum of two exponentials, plotted against the rate of [Ca2+]c decay (−d[Ca2+]c/dt) at the same periods of time, and the SR Ca2+ pumping rate was determined from Eq. 4, assuming the power function (N) and the SR Ca2+ leak (L) as 4 and 5, respectively (as described in methods). Mean data from five individual fibers obtained from the first contraction (a), the 62nd contraction (b), and at the fatigue time-point (c; control), or at the last contraction with BTS (d). The curves from the mean data were fitted with Eq. 4, but N and L were not fixed. Inset: individual rates of SR Ca2+ pumping were normalized by the first contraction and compared between control and BTS conditions. †P < 0.05 control vs. BTS, two-way repeated-measures ANOVA; n = 5 fibers. Values are expressed as means ± SE.

