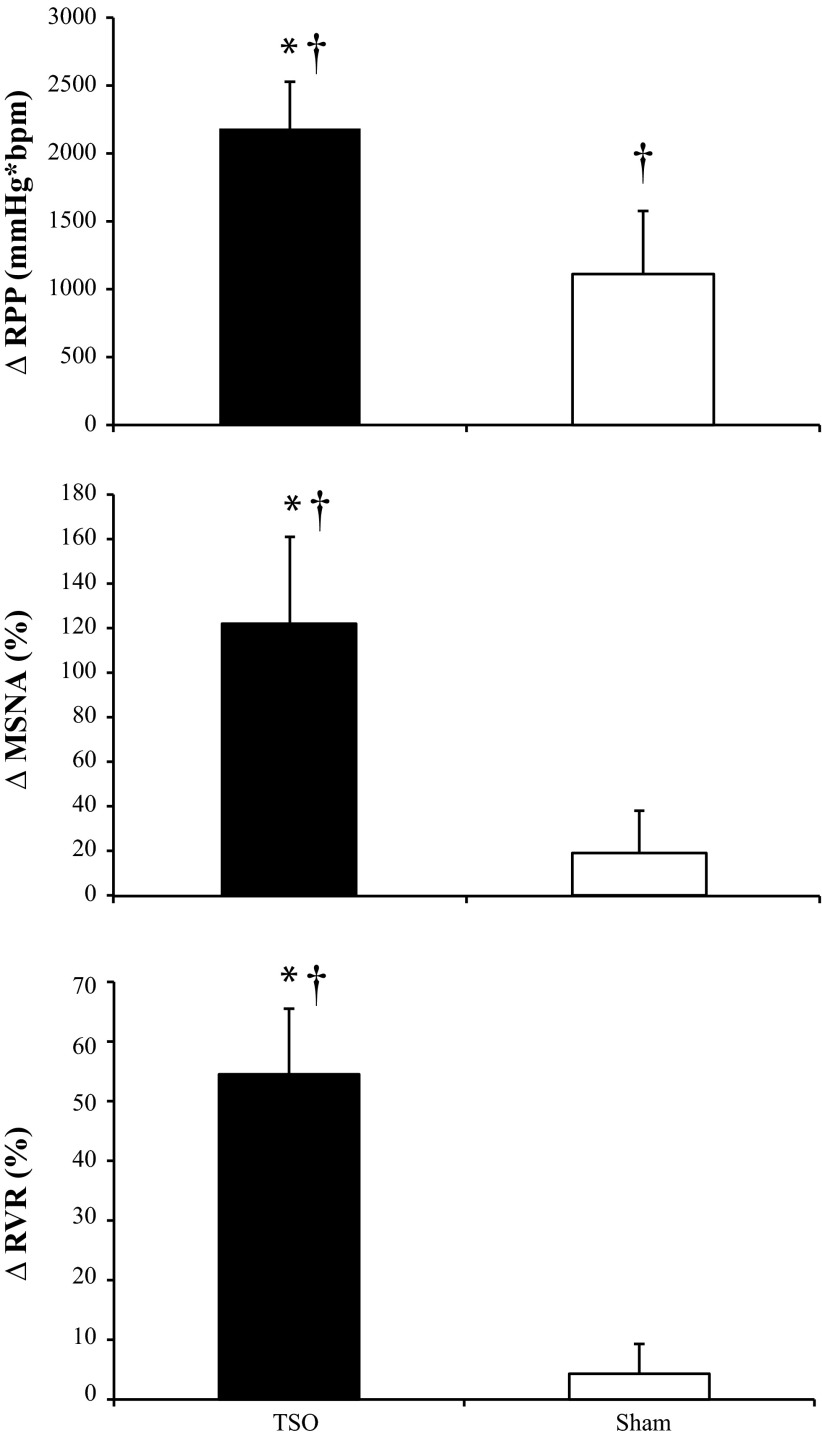
Fig. 2.
Changes in rate-pressure product (ΔRPP; top, n = 13), ΔMSNA (middle, n = 6), and renal vascular resistance index (ΔRVR; bottom, n = 8) in response to TSO (black bars) and tactile stimulation of the hard palate (Sham; white bars) during Experiment 1. Data are means ± SE. *P < 0.05 between TSO and Sham; †P < 0.05 vs. respective baseline.

