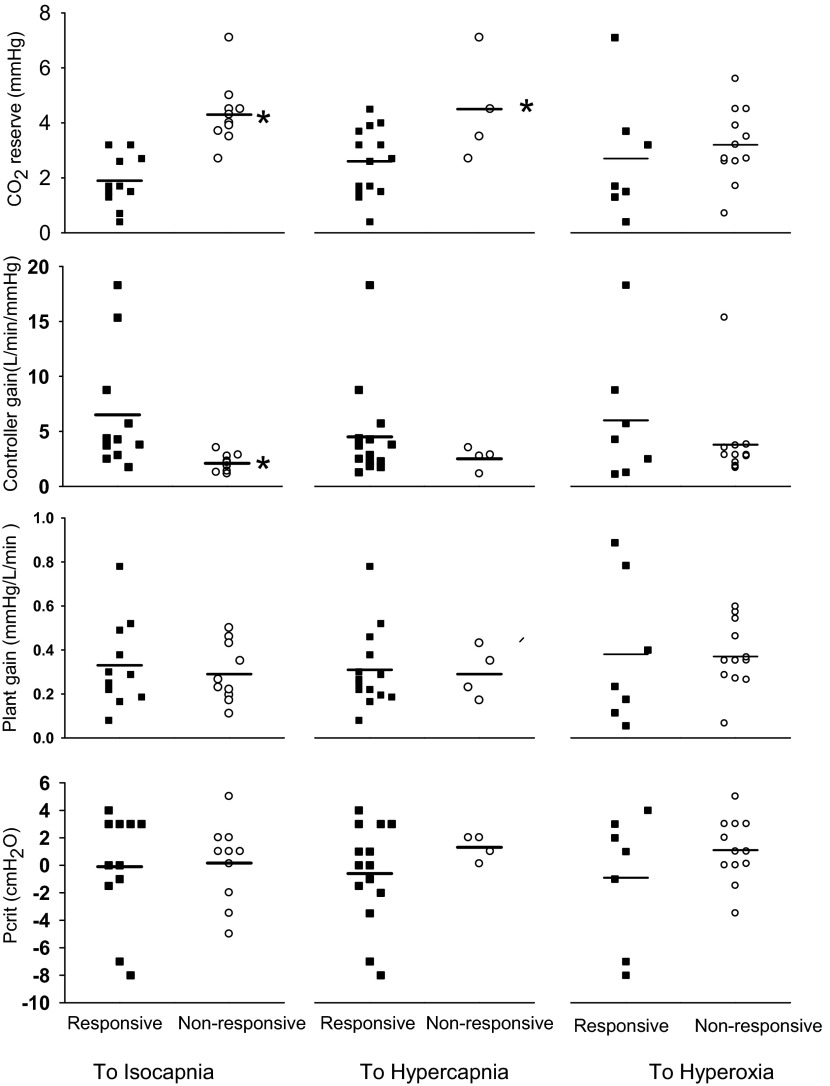
Fig. 6.
Classification characteristics of subjects who did/did not respond to each of the three treatments. For the isocapnic treatment, the responsive group demonstrated a smaller CO2 reserve (1.9 ± 0.3 vs. 4.3 ± 0.4 mmHg, *P < 0.01) and greater controller gain (6.5 ± 1.7 vs. 2.1 ± 0.2 l·min−1·mmHg−1, *P < 0.01) compared with the nonresponsive group. The same tendency was also seen in response to the hypercapnic and hyperoxic treatments, but there was substantially more overlap of individual subject values for controller gain and CO2 reserve for the responsive vs. the nonresponsive groups. Plant gain and critical closing pressure (Pcrit) values were similar for responders and nonresponders to all three treatments.

