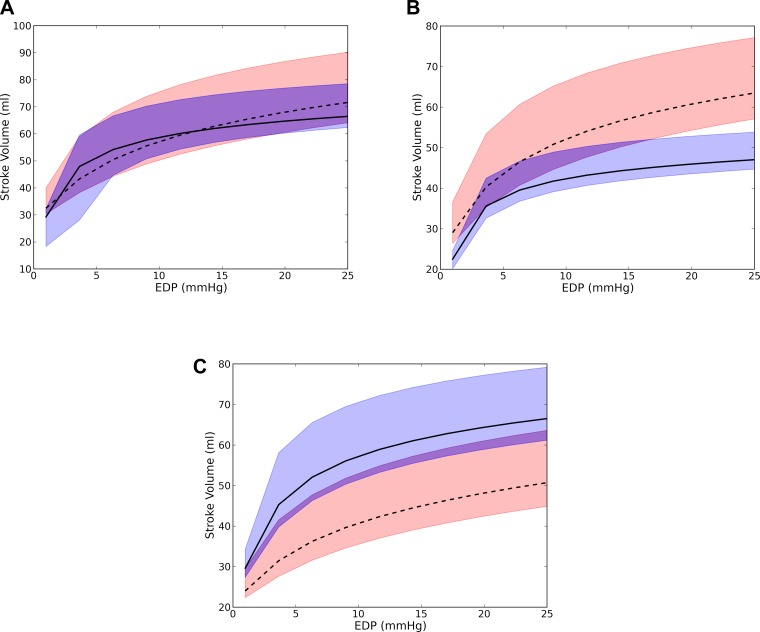
Fig. 3.
Representative Starling relationship from three patients showing no significant changes (patient 1; A), worsening (patient 2; B), and improvement after surgery (patient 4; C). Dashed line, presurgery; solid line, postsurgery. Bounds of the predicted Starling relationship are shown as the red region for presurgery and as the blue region for postsurgery. These bounds were calculated from the EDPVR and ESPVR obtained by assuming an EDP of 4 and 20 mmHg and an ESP of 90 and 110% of the systolic blood pressure.

