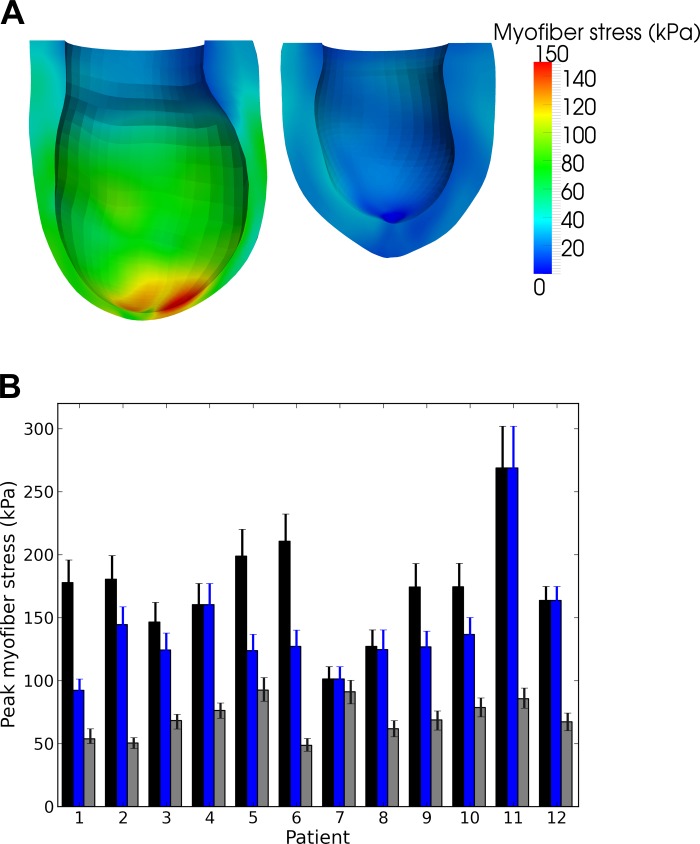
Fig. 4.
A: representative end-systolic myofiber stress distribution taken from patient 1. Left: predicted regional myofiber stress in the presurgery LV. Right: stress in the more spherical postsurgery LV. B: peak end-systolic myofiber stress of the 12 patients before and after surgery. Black, blue, and gray bars indicate peak stress in the entire presurgery LV, in the presurgery LV's remote region, and in the entire postsurgery LV, respectively. Error bars show the bounds of the peak myofiber stress when ESP was varied between 90 and 110% of the SBP.

