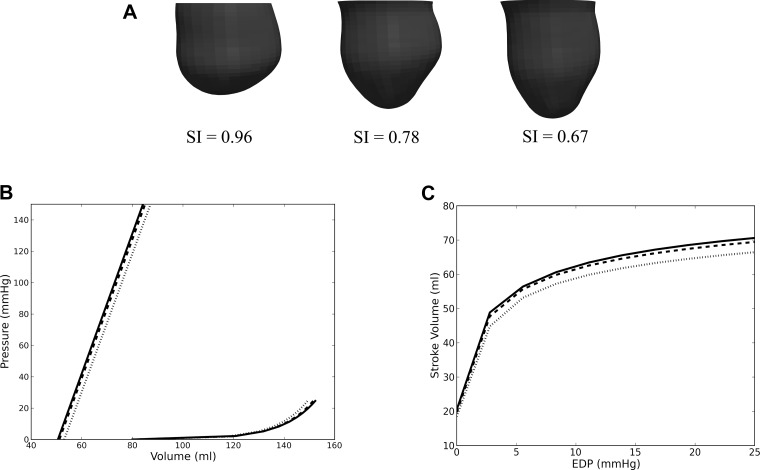
Fig. 5.
A: LV with decreasing SI from left to right. The original LV of patient 1 after surgery is shown on the left, and the “virtually elongated” LVs are on the center and right. B: effects of LV SI on EDPVR and ESPVR. C: the effects of LV SI on the Starling relationship. Dotted line, SI = 0.96; dashed line, SI = 0.78; and solid line, SI = 0.67.

