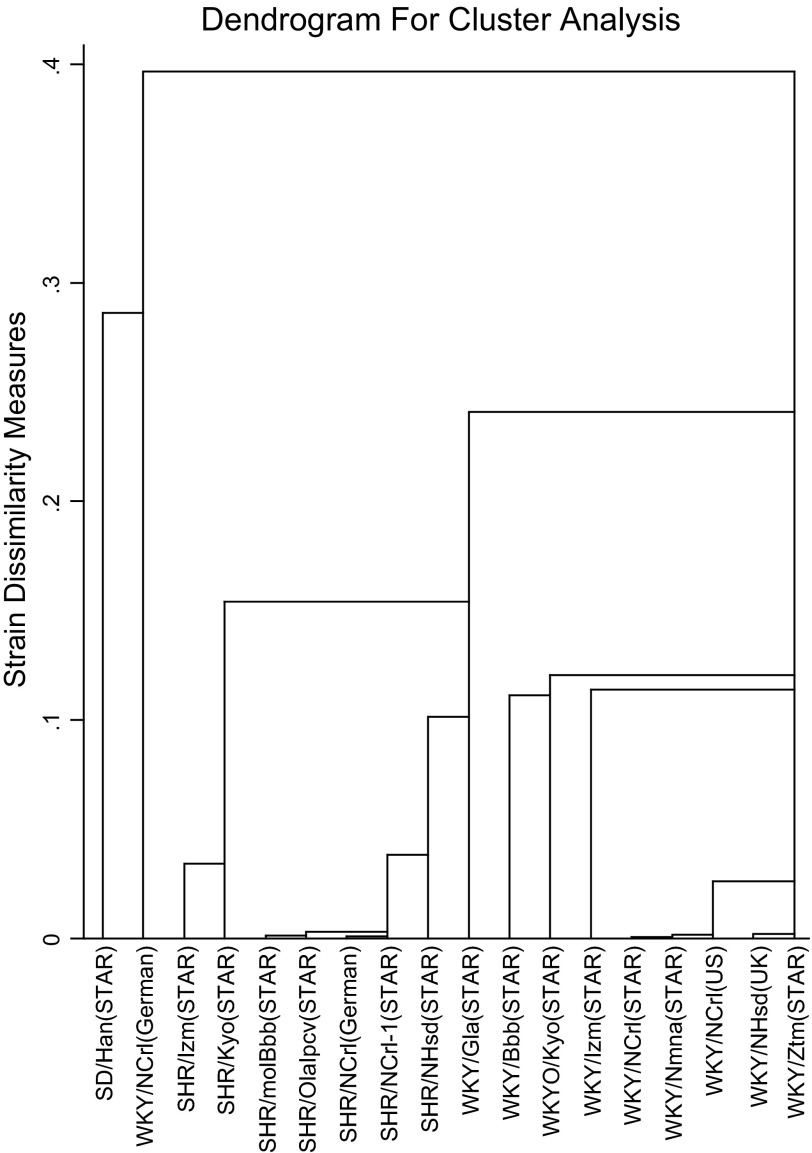
Fig. 3.
Hierarchical cluster analysis of the IBS similarity matrix. The genetic differences between the different strains are visualized by a dendrogram. Height of the each branch represents the distance between any 2 pairs. This diagram reveals 1 SHR and 2 WKY clusters, within which the smallest genetic difference was observed.

