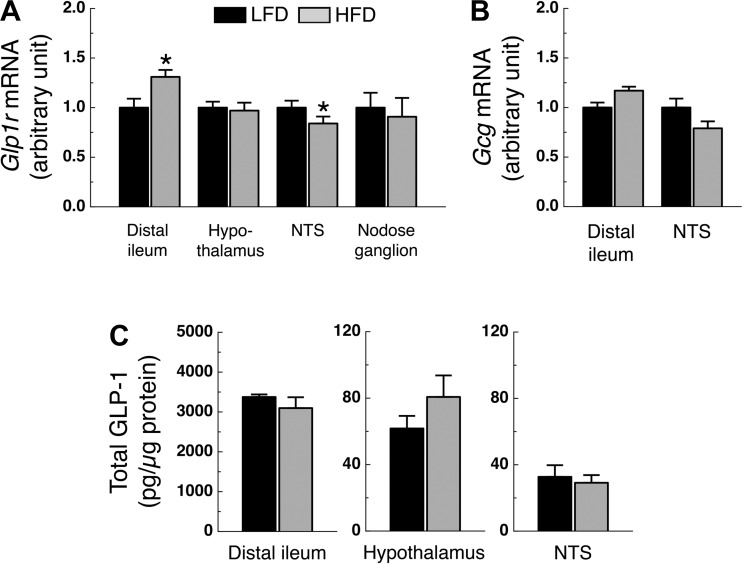
Fig. 6.
Glp1r and Gcg gene expression and GLP-1 protein levels. A: Glp1r expression in whole hypothalamus, NTS, distal ileum (n = 10–14/group), and nodose ganglion (n = 5–6/group). B: Gcg expression in NTS and distal ileum (n = 10–14/group). C: total GLP-1 levels in hypothalamus, NTS, and distal ileum (n = 7–14/group). Rats were on their respective diet for 24 wk. *P < 0.05 vs. LFD.

