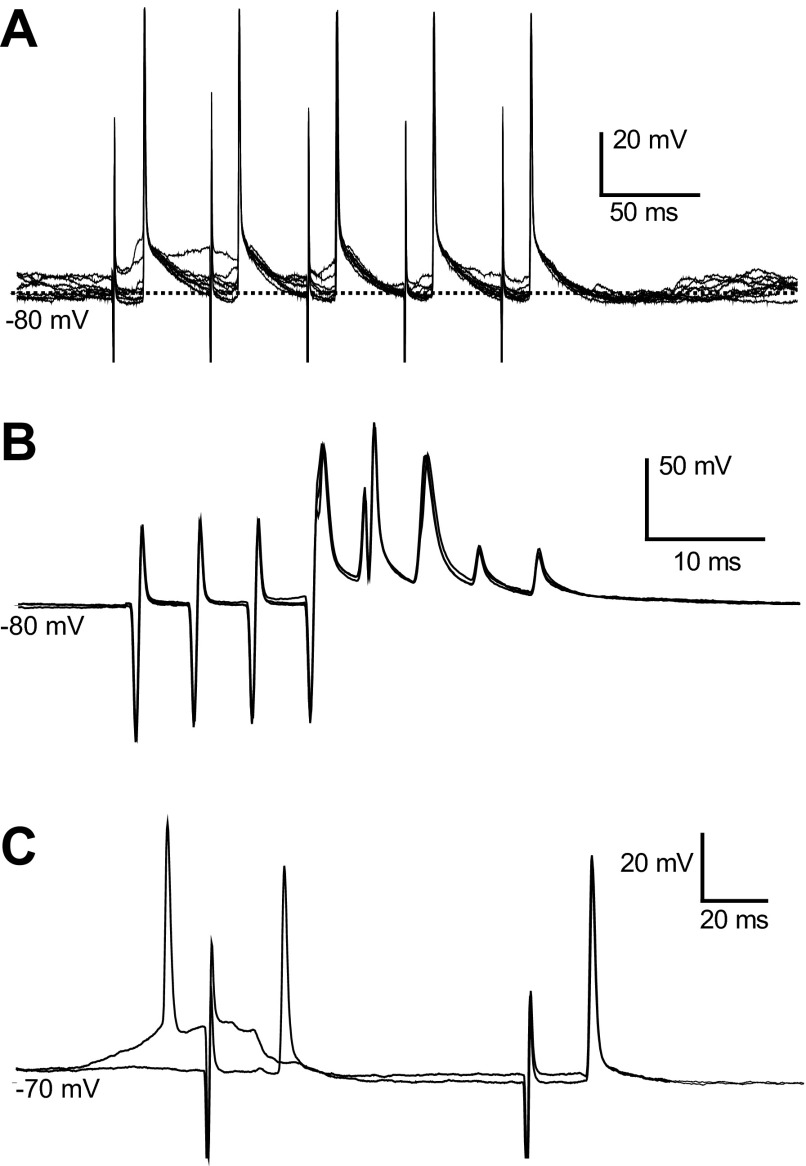
Fig. 7.
Antidromic activation from the ventral tegmental area (VTA). A: overlay of traces showing action potentials evoked by each pulse in a 20-Hz train delivered to the VTA. Action potentials were evoked with a constant latency of 9.8 ms and can be observed to rise from the down state. B: VTA-evoked action potentials follow 200 Hz stimulation. The 1st 3 action potential are full somatodendritic spikes, and the last 2 show only the initial segment component. C: overlay of 2 traces showing a spontaneous action potential (1st from left) colliding with an antidromically evoked action potential. BLA stimulation, immediately after the spontaneously occurring action potential, failed to evoke a spike.

