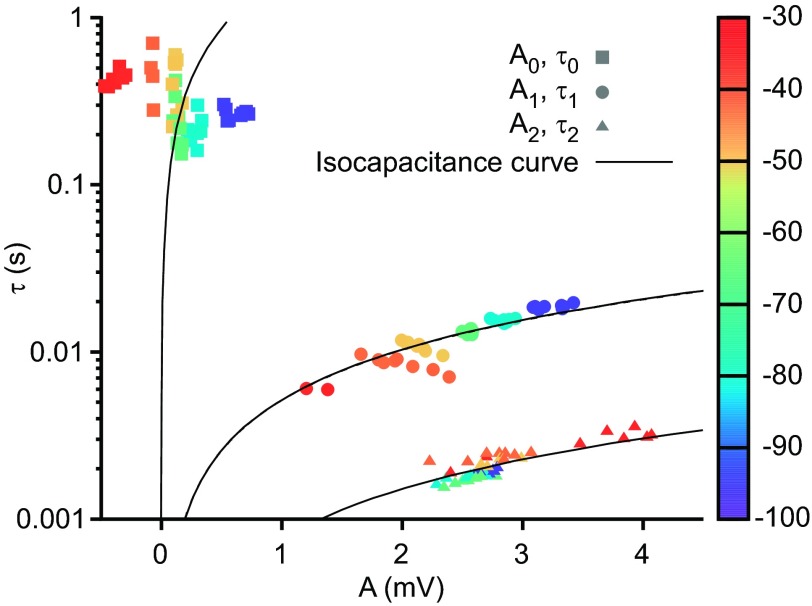
Fig. 5.
τ and A coefficients from neuron LP2's fitted exponential terms, colored by Vssc (color scale bar, right). Slow, medium, and fast exponential terms are represented by squares, circles, and triangles, respectively. Isocapacitance curves (curved black lines) for each temporal class were generated from τ = AC/Ipulse, where C is the mean of the capacitive coefficients within each class (see materials and methods). The failure of the slow term class (τ0 and A0) data to lie on their corresponding isocapacitance line, and A0 becoming negative at Vssc around −50 mV, suggests the presence of a voltage-dependent process.

