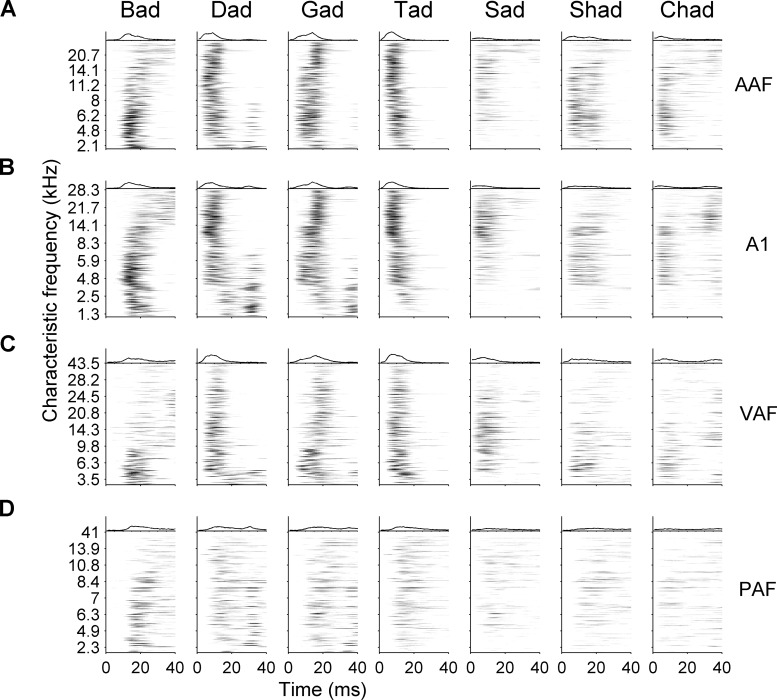
Fig. 7.
Spatiotemporal response patterns to all consonant speech sounds tested in AAF, A1, VAF, and PAF. Average response to speech sounds from each site in each field are shown, organized by characteristic frequency. The average response across all sites is shown on top of each subpanel. The average response plotted is the same as is shown in gray in Fig. 6. A: AAF sites responded strongly to all speech sounds, but responded less strong for nonstop consonants (/s/, /sh/, and /ch/). Each speech sound evoked a unique pattern of response. For example, the sound /b/ caused low-frequency sites to fire first, followed by high. The consonant /d/ caused the opposite firing pattern. B: A1 responses to speech sounds were similar to AAF and mimic previous recordings in A1. Like AAF, A1 sites responded more strongly to stop consonants. C: VAF did not have as many low-frequency sites as AAF or A1, which caused the response patterns to appear more similar. In spite of the bias in characteristic frequency, VAF sites tuned below 6 kHz did respond to the vowel portion of the speech sounds in a manner that mimicked AAF and A1 responses. D: PAF sites were more broadly tuned than the other three fields. As a result, each site responded to both the consonant onset as well as the vowel onset.

