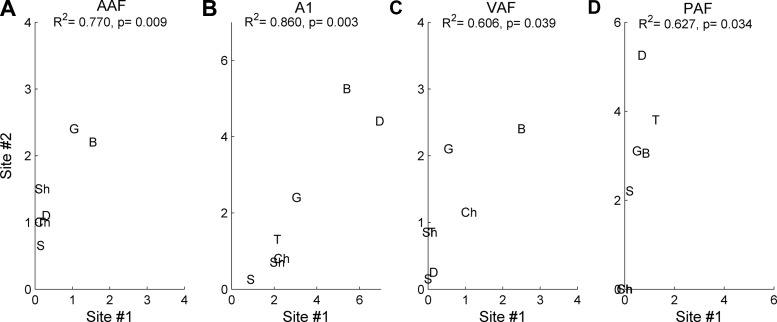
Fig. 9.
Example correlations from one pair of sites in each field. We counted the number of evoked spikes to each speech sound fired from each of two sites that were tuned within one-fourth octave of each other and quantified these pairs using the correlation coefficient. These examples represent pairs in the 75th percentile in each field. A: AAF sites fire with a similar number of spikes per sound. For example, both of these sites fired the most spikes to /b/ and /g/, and the least number of spikes to /s/. This example had an R2 of 0.77 (P < 0.01). B: A1 pairs had the highest correlation, suggesting the largest amount of redundant information. This pair had an R2 of 0.86 (P < 0.01). VAF (R2 of 0.61, P = 0.04; C) and PAF (R2 of 0.63, P = 0.03; D) pairs had weak correlations, suggesting that these fields had less redundancy in information encoding. For example, in both C and D, one site in the pair fired more spikes to /g/ than the other site in the pair.

