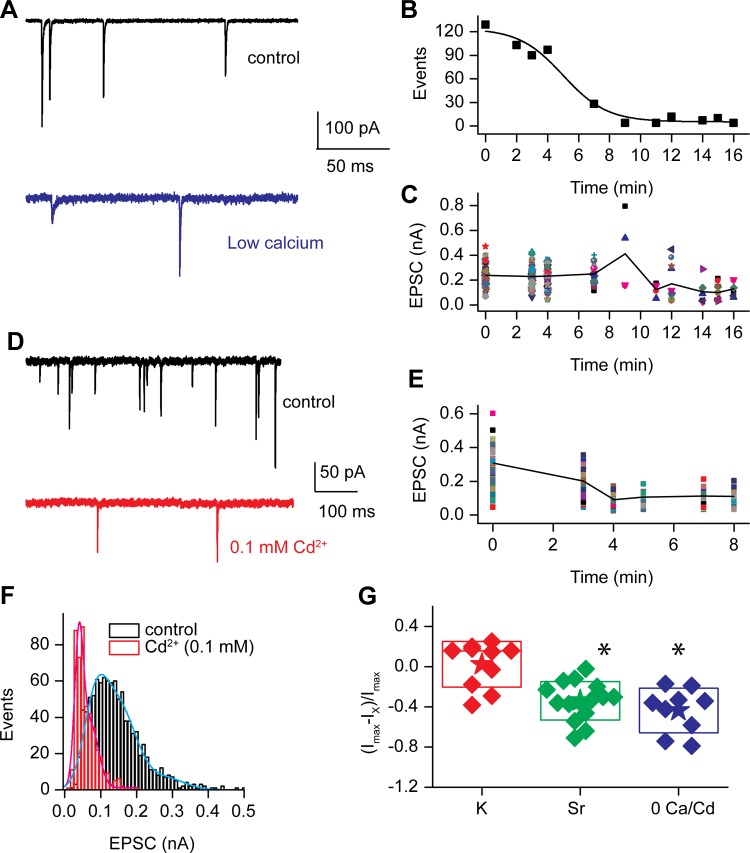
Fig. 10.
Reducing external calcium or blocking calcium channels with cadmium reduced EPSC amplitude and frequency. A: EPSCs at the start (top) and stop (bottom) of a perfusion of an EGTA-buffered external solution. The time course of reduction in frequency is shown in B. The reduction in frequency of release correlated with the reduction of EPSC amplitude. C: individual EPSC amplitudes plotted over perfusion time, demonstrating that although EPSC amplitudes are reduced, large events remain. Similar results were obtained by perfusing 0.1 mM Cd2+ onto the preparation. D: examples of EPSCs prior to (top) and at the end of (bottom) perfusion. E: time course of amplitude reduction during Cd2+ application where individual EPSC amplitudes are plotted at various time points. F: amplitude histograms for the cell in D for the control and in the presence of Cd2+. The control data were fit with the equation for a triple Gaussian, resulting in peaks and half-widths of 0.084 ± 0.06 nA, 0.148 ± 0.1 nA, and 0.28 ± 0.1 nA (r2 = 0.97), while the data in the presence of Cd2+ were fit with the equation for a double Gaussian, with peaks and half-widths of 0.04 ± 0.008 nA and 0.07 ± 0.04 nA (r2 = 0.88). G: relative change in peak amplitude of EPSCs under different conditions including K+ (red) Sr2+ (green), or low divalent 0 mM Ca2+ or Cd2+ (blue). *Significant difference at P < 0.05.

