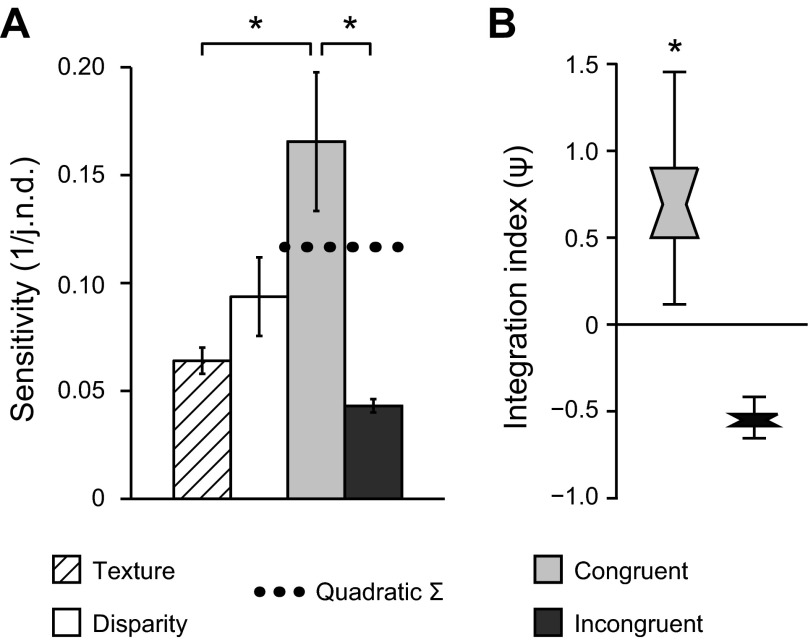
Fig. 4.
Behavioral tests of cue integration. A: bars represent the mean sensitivity across observers (n = 12) and base slants for the 4 experimental conditions. Sensitivity is calculated as the reciprocal of the just noticeable difference (j.n.d.). Error bars show between-observer SE. Dashed horizontal line indicates predicted sensitivity for combined cue conditions based on quadratic summation of the observed sensitivities to individual cue conditions. *P < 0.05. B: distribution plots of bootstrapped psychophysical integration indices for combined-cue conditions. A value of zero indicates that combined-cue performance was equal to that predicted by quadratic summation. Notches represent median, boxes represent 68% confidence intervals, and error bars represent 95% confidence intervals. *P < 0.001.

