Figure 3.
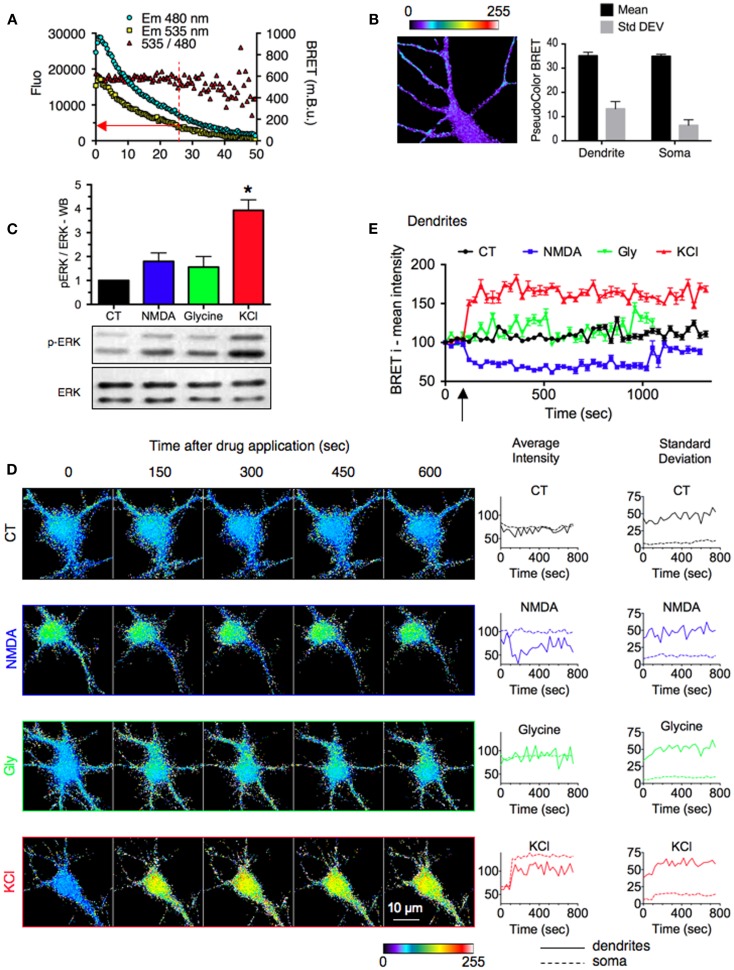
Stimulus-specific responses of ERK signaling reported by REV in neuronal sub-cellular compartments. (A) Evolution of Em480, Em535, and 535/480 ratio signals over time. Sequential BRET images on neurons expressing REV were acquired for 50 min. The red arrow indicates the cut-off value for luminescence intensity below which BRET fluctuations prevented adequate measurements. (B) Basal signal resulting from the overflow of the energy donor output into the energy acceptor detection channel. Neurons were transfected with RE (REV construct without Venus). Left, representative BRET image. Right, BRET intensity (mean) and distribution (Standard Deviation) in soma and dendrites. Each bar of the histogram represents the mean ± SEM obtained from three to six neurons and seven regions per neuron. (C) ERK and phospho-ERK (p-ERK) staining quantified by western blot in hippocampal neurons stimulated or not (black) with NMDA (50 μM, blue), Glycine and strychnine (200 and 1 μM, respectively, green), or KCl (50 mM, red) for 10 min. (D) Real-time BRET imaging of four representative hippocampal neurons transfected with REV, in the stimulated conditions described in (A). Changes of average intensity and standard deviation over time were measured on the soma and dendritic shaft of each image. (E) Intensities of BRET signals recorded on dendrites of neurons in BRET images over time. Each point of the graph represents the mean ± SEM obtained from three to six neurons and seven regions per neuron, for each time condition.

