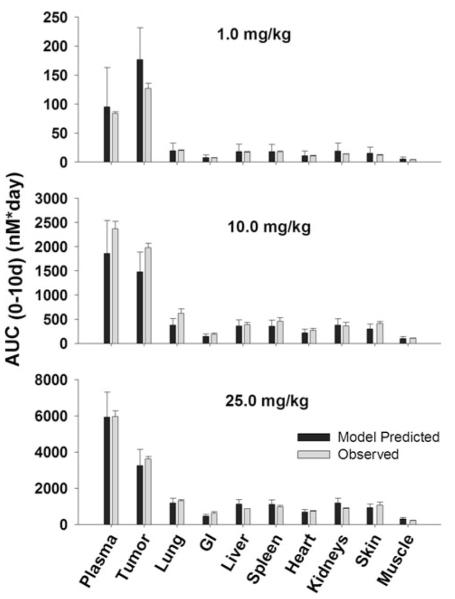
Fig. 3.
Comparison of PBPK model-predicted and observed T84.66 population mean AUCs in LS174T xenograft-bearing SCID mice. Black bars represent the predicted T84.66 AUC0–10 days in plasma, LS174T tumors, and other tissues. Error bars represent the standard deviation around the mean (n = 1,000 subjects). Gray Bars represent the observed mean T84.66 AUC0–10 days in plasma, tumor and other tissues. Sub groups of three mice were sacrificed at several time points (t = 1 h–10 days), AUCs were calculated using NCA for sparse sampling module (WinNonlin 6.1). Error bars represent the standard deviations around the mean calculated using a modified Bailer method

