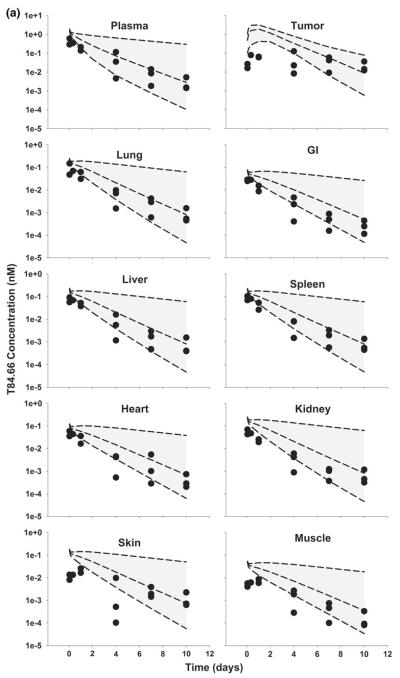
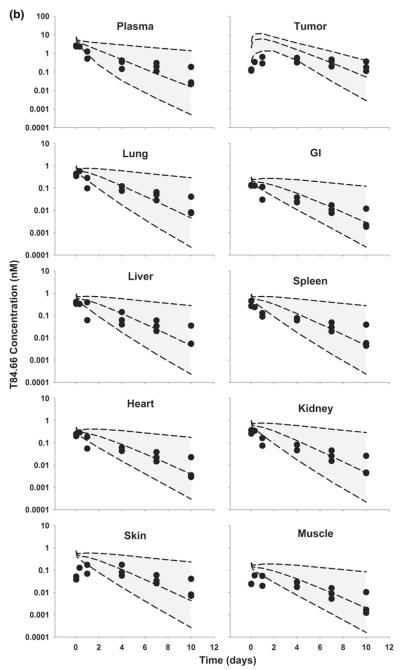
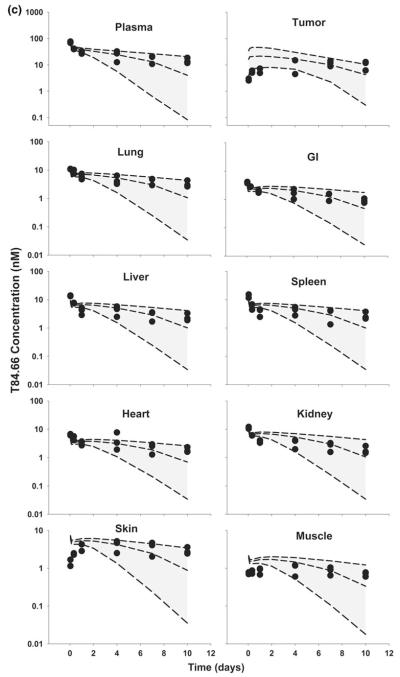
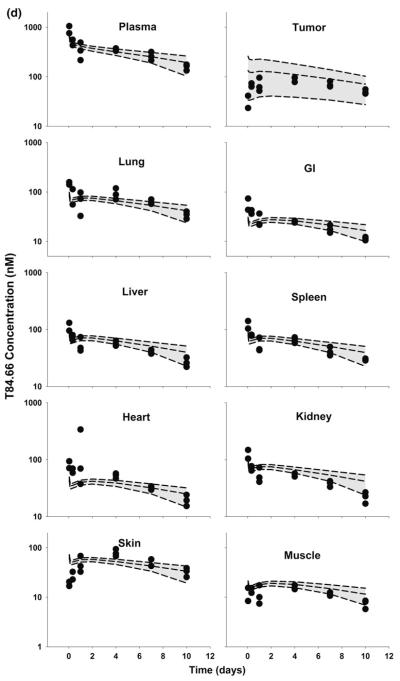
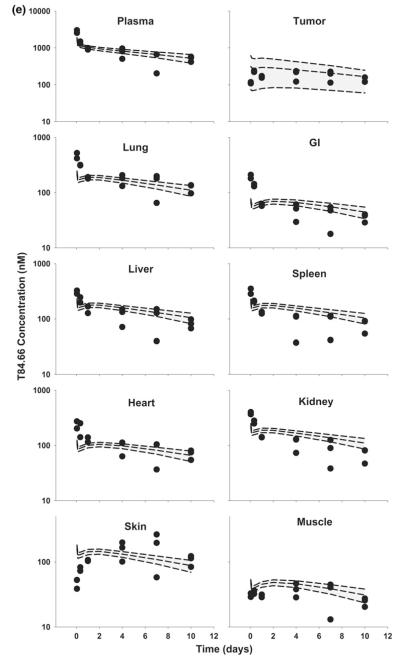
Fig. 6.
Comparison of PBPK model-predicted and observed T84.66 plasma and tissue concentration versus time profiles in HT29 xenograft-bearing SCID mice. The shaded area represents the PBK model-predicted population confidence interval (n = 1,000 subjects). Dashed lines represent the predicted 5th, 50th and 95th percentiles. Filled circles represent the observed concentrations from individual mice. The curves represent T84.66 concentration versus time profiles after intravenous injection of a 0.025 mg/kg, b 0.1 mg/kg, c 1.0 mg/kg, d 10 mg/kg, e 25 mg/kg to HT29-xenograft bearing SCID mice

