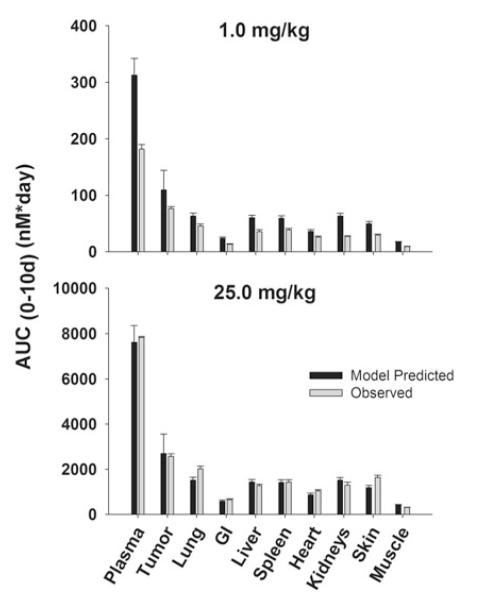
Fig. 7.
Comparison of PBPK model-predicted and observed 8C2 AUC values in LS174T xenograft-bearing SCID mice. Black bars depict the mean population predicted 8C2 AUC0–10 days in plasma, LS174T tumors, and in other tissues. Error bars represent the standard deviation around the mean (n = 1,000 subjects). Gray bars represent the mean 8C2 AUC0–10 days in plasma, tumor, and other tissues. Sub groups of three mice were sacrificed at several time points (t = 1 h–10 days). Error bars represent the standard deviations around the mean, calculated using a modified Bailer method

