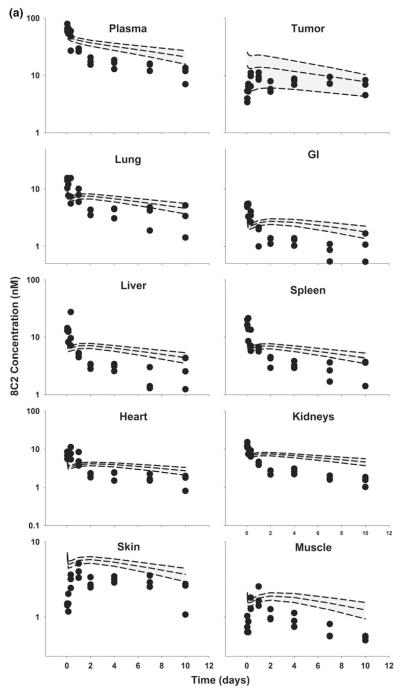
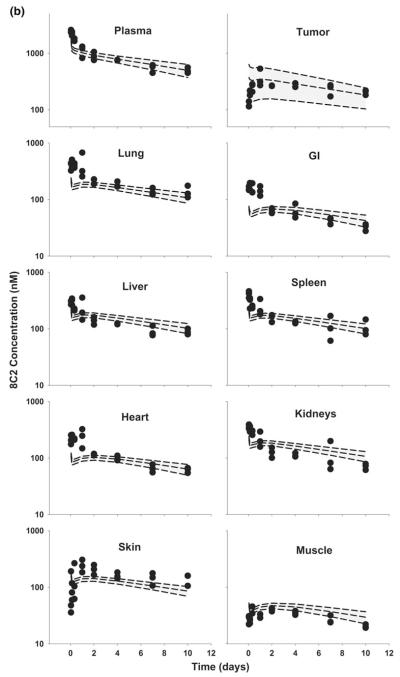
Fig. 8.
Comparison of PBPK model-predicted and observed 8C2 plasma and tissue concentration versus time profiles in LS174T xenograft-bearing SCID mice. The shaded area represents the PBPK model-predicted confidence interval (n = 1,000 subjects), and dashed lines represent the predicted 5th, 50th and 95th percentiles. Filled circles represent the observed concentrations from individual mice. Curves depict 8C2 concentration versus time data after intravenous injection of a 1 mg/kg, and b 25 mg/kg into LS174T-xenograft bearing SCID mice


