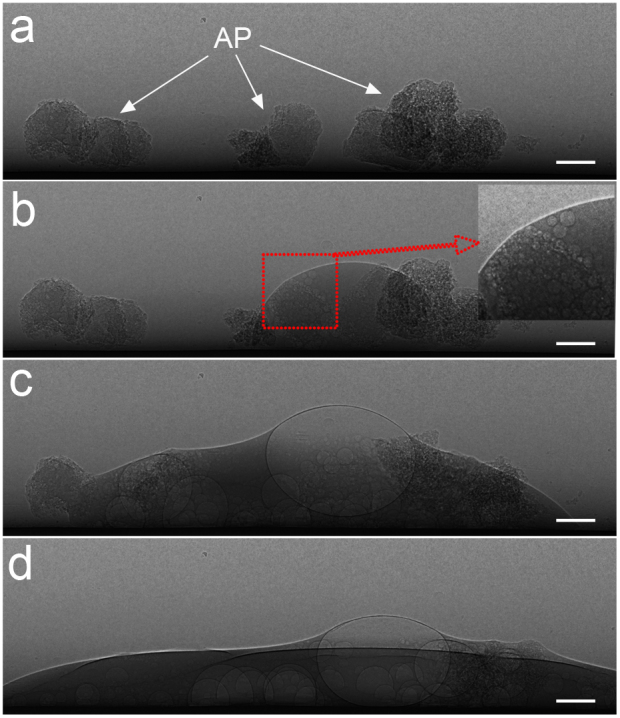
Figure 3. Representative, sequential PCI of CO2 gas production and aerogenic powders solution.

CO2 gas was continuously produced, and the aerogenic powders gradually dissolved in the physiological saline. Images were obtained after the physiological saline injection at 0 s (a), 1 s (b), 30 s (c), and 4 min (d), respectively. The pixel size was 9 μm × 9 μm; the exposure time was 3 ms. AP indicates aerogenic powders. Scale bars: 1 mm.
