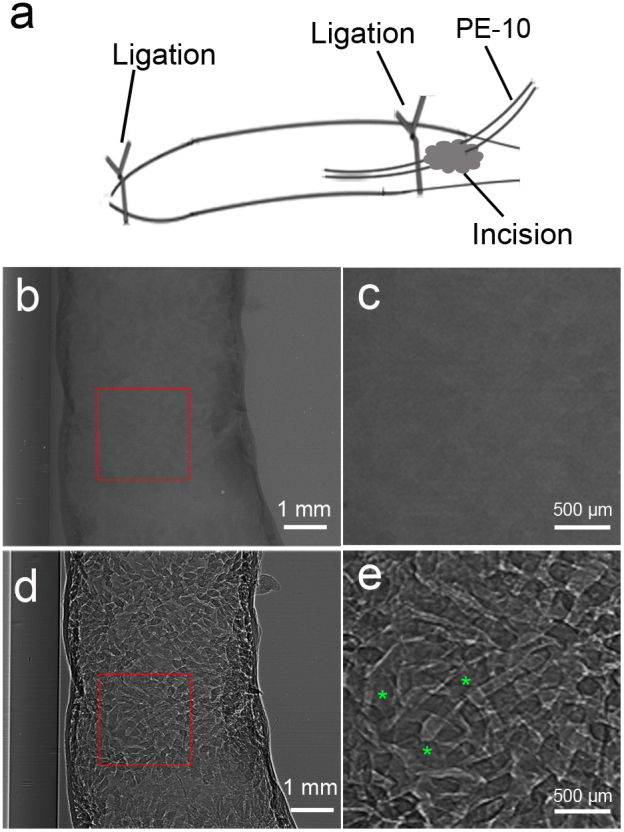
Figure 4. Ex vivo SR images of the same mouse duodenum with two sample-to-detector distances of 1 cm (b) and 60 cm (d).

(a) Schematic of the CO2 single contrast preparation. (c) and (e) are magnified images of the region in a red box in (b) and (d), respectively. Note that duodenal mucosal microstructures could be more visibly revealed on phase contrast image (e) than on absorption contrast image (c). The pixel size was 3.7 μm × 3.7 μm. The exposure time was 1 s. Asterisks indicate mucosal folds.
