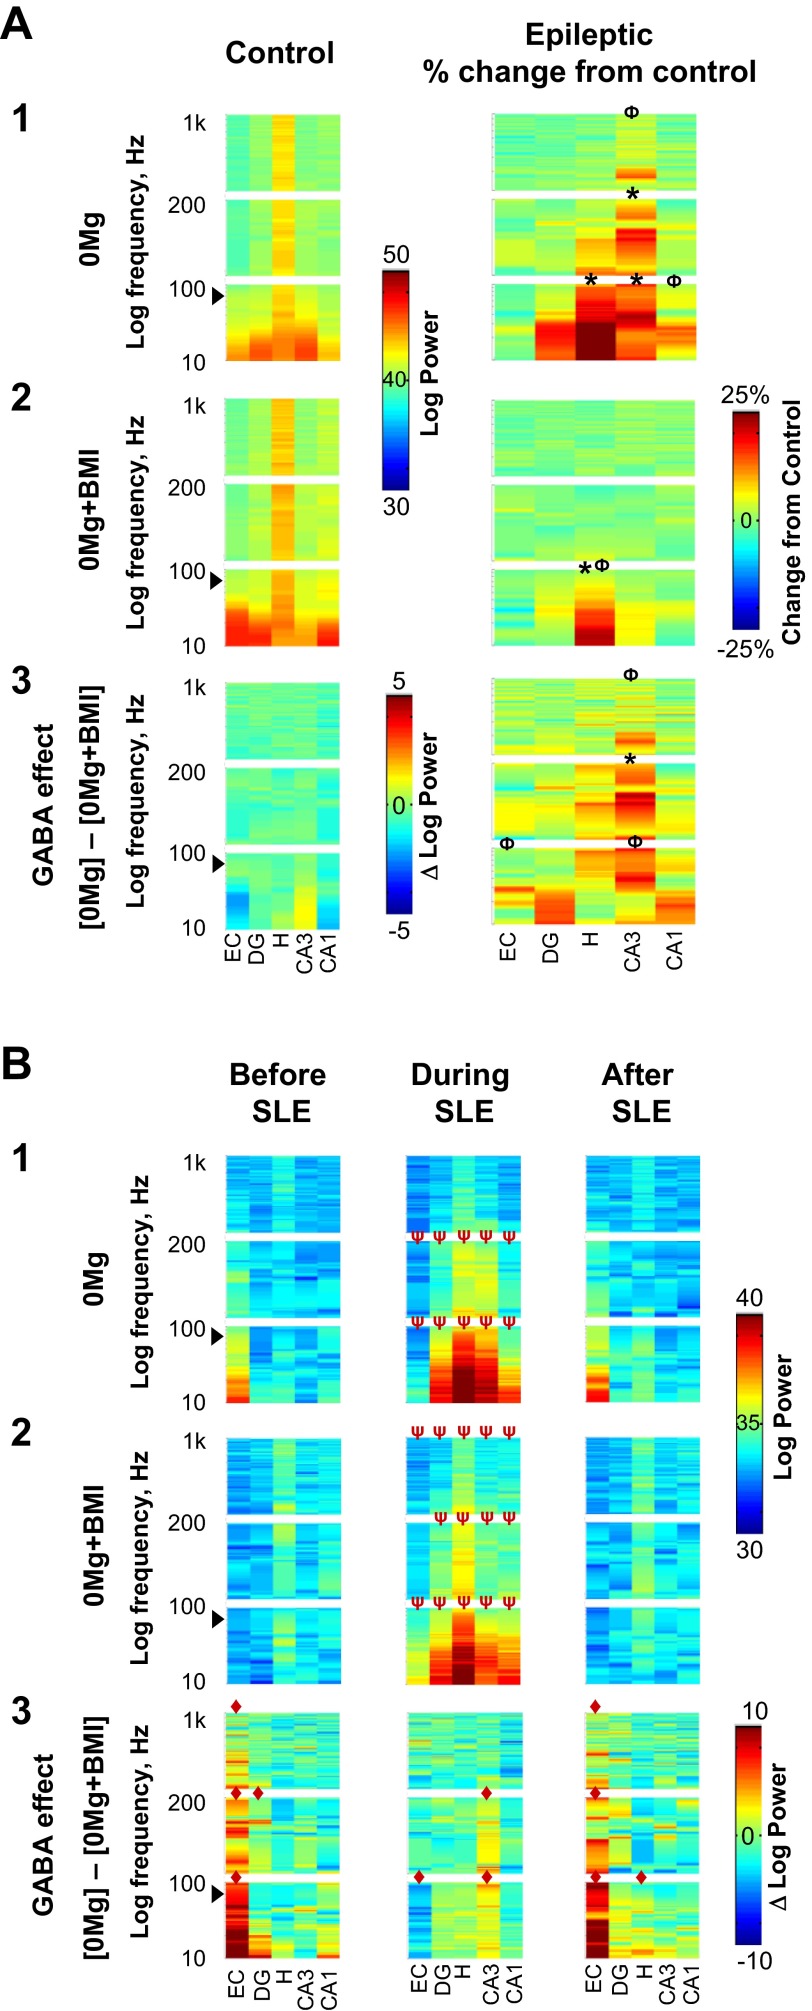
Fig. 5.
When excitatory transmission was enhanced, hilar spectral slow oscillation correlation was elevated and GABAergic transmission facilitated CA3 spectral slow oscillation and ripple correlation. Correlation of oscillation frequencies in individual 0.5-s windows arising from different electrodes within individual regions were calculated for slices from control (A, left) and epileptic (A, right and B) rats; correlations were then compiled and compilations plotted as power spectra as described in materials and methods. Although stand-alone population spikes (∼7 ms in duration) were excluded from analysis, population spikes superimposed on suprathreshold slow oscillations may contaminate slow oscillation results at ∼71 Hz (arrowheads). The y-axis is stretched to yield equal height panels for each frequency range. A: correlations of each 0.5-s window recorded from different electrodes within an individual region were compiled for all 0.5-s windows in the entire duration of recording. A1: in 0Mg, spectral slow oscillation correlations within the hilus, CA3, and CA1 as well as spectral ripple and fast ripple correlations in CA3 were greater in slices from epileptic (n = 11) compared with control (n = 7) rats. A2: in 0Mg+BMI, only hilar spectral slow oscillation correlation was higher in epileptic (n = 9) compared with control (n = 8) rats. A3: subtraction of power spectra in A1 and A2 revealed that when excitatory transmission was enhanced, GABAergic transmission (right) facilitated spectral slow oscillation and ripple correlations within CA3 to a greater degree in slices from epileptic rats, which was significantly greater in epileptic compared with control rats. B: correlations were calculated for all 0.5-s windows in the 3 s immediately before SLE (left), the first 3 s of SLE (center), and the first 3 s after SLE termination (right) in slices from epileptic rats. The start of SLE was defined as described in materials and methods. B1: in 0Mg, spectral slow oscillation and ripple correlations were decreased in the entorhinal cortex and increased in the dentate gyrus, hilus, CA3, and CA1 during SLE compared with before and after SLE. B2: in 0Mg+BMI, spectral slow oscillation, ripple, and fast ripple correlations were increased in all hippocampal regions during compared with before and after SLE. B3: subtraction of power spectra in B1 and B2 revealed that when excitatory transmission was enhanced GABAergic transmission facilitated spectral slow oscillation, ripple, and fast ripple correlations within the entorhinal cortex immediately before and after SLE (left and right) and decreased entorhinal spectral slow oscillation correlation and facilitated spectral slow oscillation and ripple correlations within CA3 during SLE (center). *Overall range different from control, Φat least 1 peak wider than 5 Hz different from control, ◆overall range difference between 0Mg and 0Mg+BMI, ψoverall range different from before and after SLE, P < 0.05, 2-way ANOVA with Sidak post hoc comparison. Scale bar in A1 and 2, left, applies to both left panels in A1 and 2; scale bar in A2, right, applies to all right panels in A1–3; scale bar in A3, left, applies only to that panel. Scale bar in B1 and 2, right, applies to all panels in B1 and 2; scale bar in B3, right, applies to all panels in B3.

