Fig. 7.
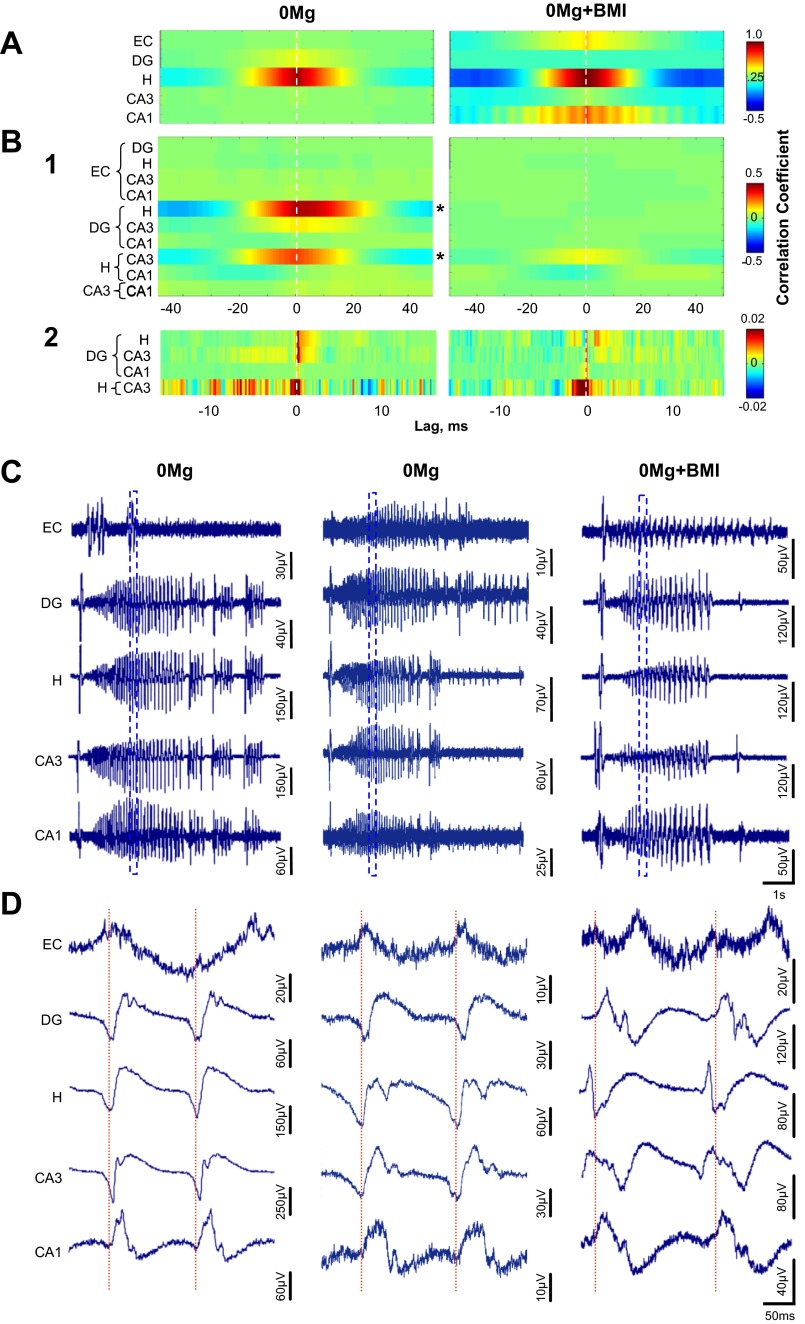
When excitatory transmission was enhanced, GABAergic transmission was not required for SLE cross-correlation within the hilus but was required for SLE cross-correlation between the hilus and other hippocampal regions. Cross-correlations vs. lag were calculated for 0Mg (left, n = 11 slices/rats)- and 0Mg+BMI (right, n = 9 slices/rats)-induced SLE in slices from epileptic rats as described in materials and methods. A: cross-correlations of waveforms recorded by different electrodes within an individual region were high in the hilus and were similar in 0Mg (left) and 0Mg+BMI (right). Right: weaker cross-correlations within the entorhinal cortex and CA1 were apparent in 0Mg+BMI, but they were not significantly different from 0Mg. B1: cross-correlations of waveforms recorded from electrodes in different regions were high between the hilus and the dentate gyrus and between the hilus and CA3 in 0Mg (left) and were significantly lower in 0Mg+BMI (right). B2: similar results were seen with the autoregressive moving average (ARMA) model prior to performing cross-correlations. Exceptions were a more prominent cross-correlation between CA3 and the dentate gyrus and a second series of cross-correlation peaks between CA3 and the hilus in 0Mg (left) but not 0Mg+BMI (right). Reference regions for the cross-correlation lags are on right. C: representative SLE recorded simultaneously from all cortico-hippocampal regions in 0Mg (left and center) and 0Mg+BMI (right). D: expanded time scale of traces enclosed by boxes in C illustrates slight time lags between the hilus, CA3, and dentate gyrus (left) and time lock between the hilus and CA3, with a slight time lag with the dentate gyrus in 0Mg (center), and time lock between CA3 and the hilus in 0Mg+BMI (right). *Difference between 0Mg and 0Mg+BMI, P < 0.05, 2-way ANOVA. Horizontal scale bar in C, bottom right, applies to all traces in C; horizontal scale bar in D, bottom right, applies to all traces D.

