
Fig. 5.
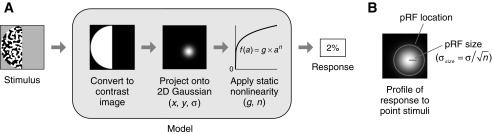
Compressive spatial summation (CSS) model. A: schematic of CSS model. The model starts with a contrast image that represents the location of the stimulus in the visual field. To predict the response, the contrast image is weighted and summed using an isotropic 2-dimensional (2-D) Gaussian and then transformed by a static power-law nonlinearity. When the power-law exponent is <1, the nonlinearity is compressive, and the model predicts subadditive spatial summation. B: definition of pRF size and location. The response of the CSS model to point stimuli placed at different visual field positions has a Gaussian profile. We define pRF size to be the standard deviation of this Gaussian profile, σsize. We represent pRF location using a circle with radius 2σsize.