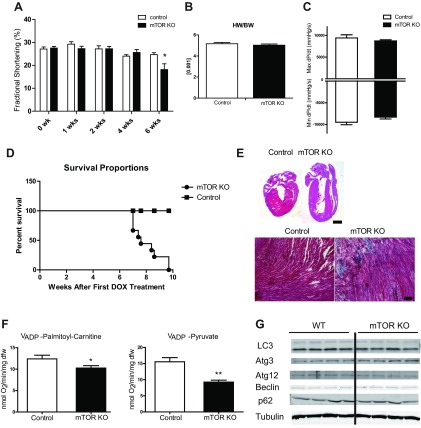
Fig. 6.
Development of cardiac dysfunction and lethality in mTOR KO mice. A: serial echocardiography of control and mTOR KO mice. n = 5–8. B: heart weight of control and mTOR KO mice normalized to body weight 4 wk after doxycycline (DOX) treatment. n = 7–10. C: cardiac hemodynamic parameters measured by catheterization 4 wk after DOX treatment. n = 6–7. D: survival curve of mTOR KO mice after DOX treatment. n = 9–10. E, top: four-champer view of a control heart and an mTOR KO heart 6 wk after DOX treatment stained with hematoxylin and eosin. Scale bar = 1 mm. Bottom, trichrome staining of histological sections from control and mTOR KO hearts. Scale bar = 50 μm. F: mitochondrial respiration of cardiac fibers from control and mTOR hearts 6 wk after DOX treatment supplemented with palmitoyl-carnitine or pyruvate. G: Western blots of autophagy-related proteins in control and mTOR KO hearts 4 wk after DOX treatment. The Western blot was done with the same set of samples used in Fig. 1A. The same tubulin blot was used as a loading control. *P < 0.05; **P < 0.01.

