
Fig. 1.
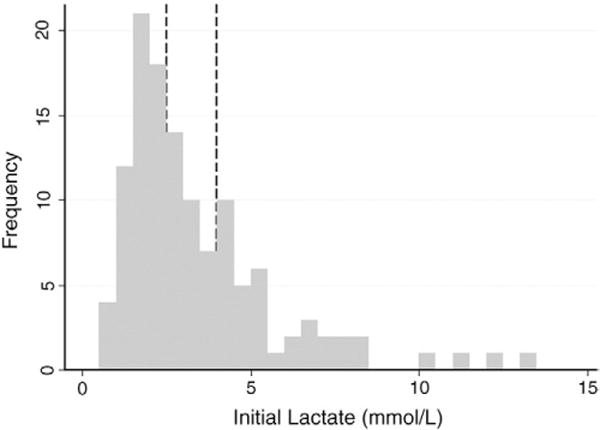
Histogram of lactate values for study subjects. Lines show cutoff values for nonlactate expressors, intermediate, and high-lactate categories.
Official websites use .gov
A
.gov website belongs to an official
government organization in the United States.
Secure .gov websites use HTTPS
A lock (
) or https:// means you've safely
connected to the .gov website. Share sensitive
information only on official, secure websites.
Histogram of lactate values for study subjects. Lines show cutoff values for nonlactate expressors, intermediate, and high-lactate categories.