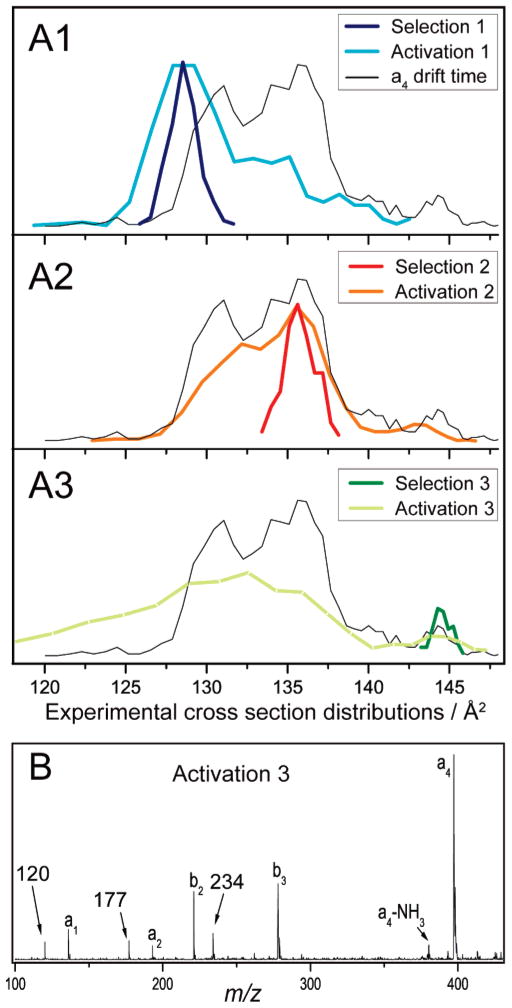
Figure 5.
(A1–3) Cross-section distributions of mobility-selected ions prior to and after collisional activation. The drift time distribution of the whole a4 distribution is indicated with a fine line as a reference. Note that the intensity scale has been arbitrarily normalized to allow for a better comparison. (B) CID mass spectrum of mobility-selected a4, using mobility selection 3 from above. The expected a and b ions are indicated, as well as the masses of other fragment ions that are less straightforward to interpret.

