
Figure 6.
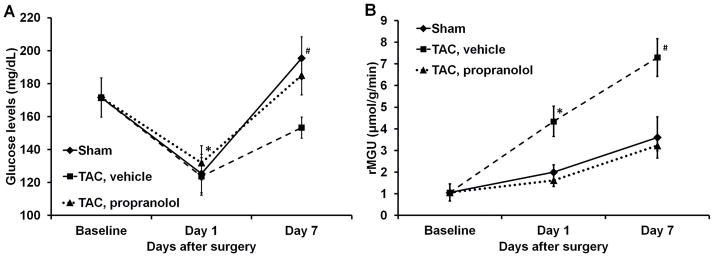
Figure 6A. Blood glucose levels. The plot shows the average blood glucose levels measured at each time point for the sham, TAC and the TAC mice treated with propranolol. All the values are mean ± SEM. *p<0.05 vs BSL and day 1. #p<0.05 vs TAC at day 7. 6B. Rate of myocardial glucose utilization. rMGU was measured at each time point for the sham, TAC and TAC mice treated with propranolol. All the values are mean ± SEM.*p<0.05 vs BSL, day 1, TAC treated with propranolol and sham groups. #p<0.05 vs BSL, TAC treated with propranolol and sham groups.