
Figure 7.
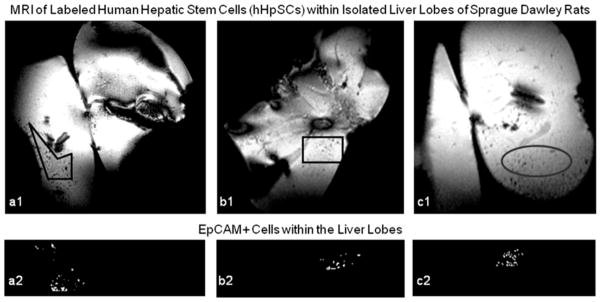
In Vivo MR images from rat liver lobes inoculated with labeled cells. Panels a, b, and c illustrate liver lobes heterogeneously inundated with labeled cell aggregates. Dense cell signals are highlighted in Panels a1, b1, and c1; the same signals are threshold imaged in Panels a2, b2, and c2.