
Fig. 2.
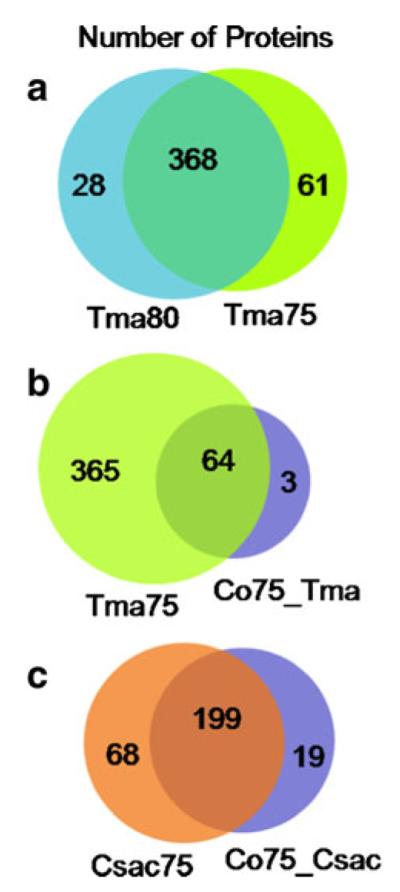
Venn diagrams summarizing the thermophilic bacterial proteins with <1% FDR between a the T. maritima samples grown at 75 °C and 80 °C, b the T. maritima culture grown at 75 °C versus the co-culture sample, and c the C. saccharolyticus sample versus the co-culture sample