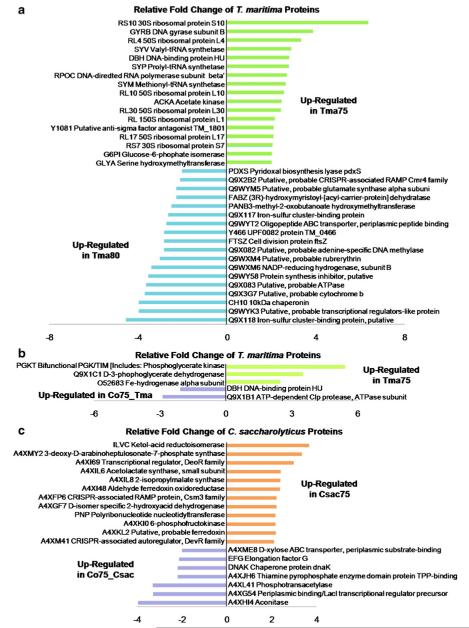
Fig. 4.
Bar graphs displaying greater than twofold change in relative expression of proteins identified with ≥4 SpC in both compared samples. Positive values indicate an increase in protein expression while negative values indicate a decrease in protein expression of a Tma75 with respect to Tma80 (35 proteins), b Tma75 with respect to Co75_Tma (5 proteins), and c Csac75 with respect to Co75_Csac (19 proteins)

