Figure 4.

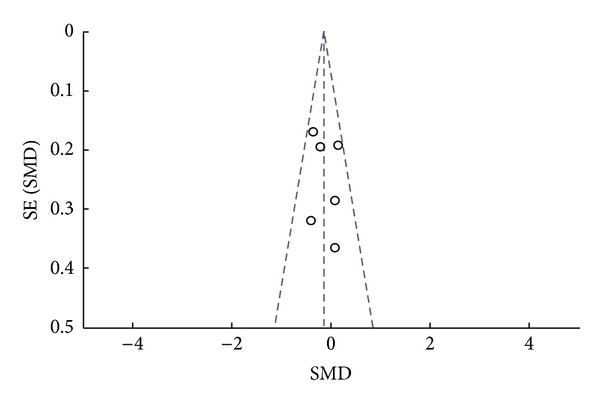
Funnel plot. Assessing publication bias using the SMD and 1/SE values from one of the tertiary outcome measures (serum total IgE level).

Funnel plot. Assessing publication bias using the SMD and 1/SE values from one of the tertiary outcome measures (serum total IgE level).