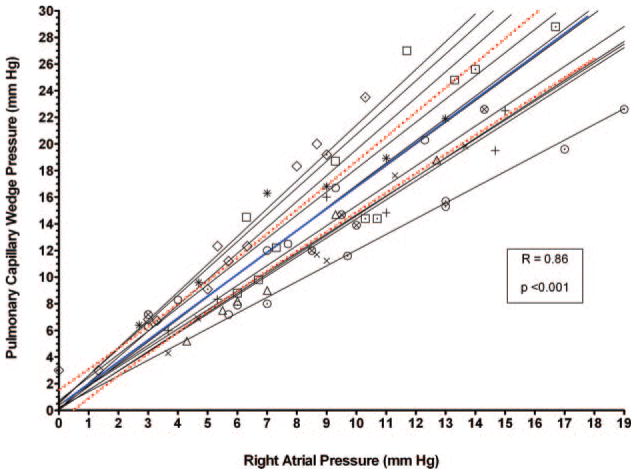
Figure 2.
Scatterplot of RAP versus PCWP in individual patients (light gray lines) and the overall cohort (blue line) using all loading conditions. The blue line indicates the overall regression equation in the entire cohort, and the red lines are the 95% CIs. The symbols represent data points from individual patients.

