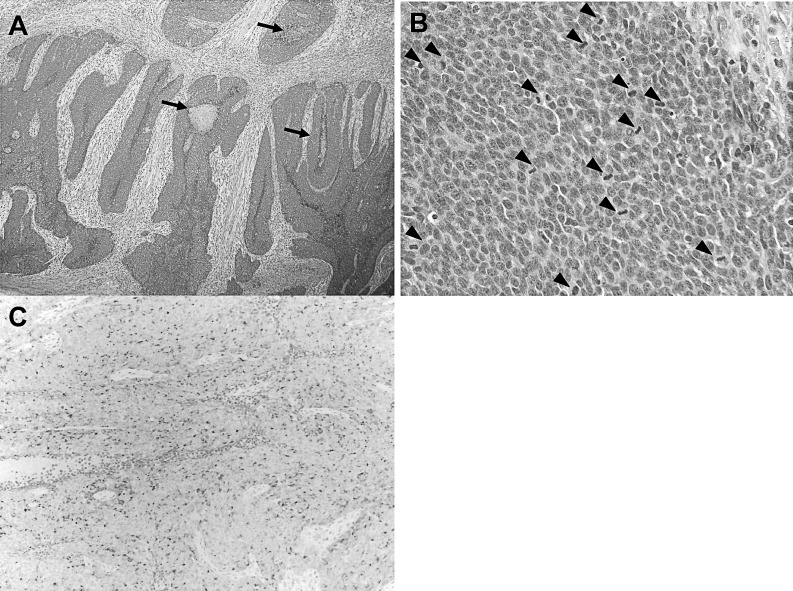
Fig. 3.
(A) Tumor cells formed focal solid structures. Arrows indicate areas of central necrosis. H&E (×40). (B) Tumor cells were round to oval in shape with scanty cytoplasm. They were hyperchromatic and showed a high frequency of aberrant mitosis. Arrowheads indicate mitotic figures. H&E (×400). (C) Tumor cells were diffusely positive for chromogranin-A (×40).

