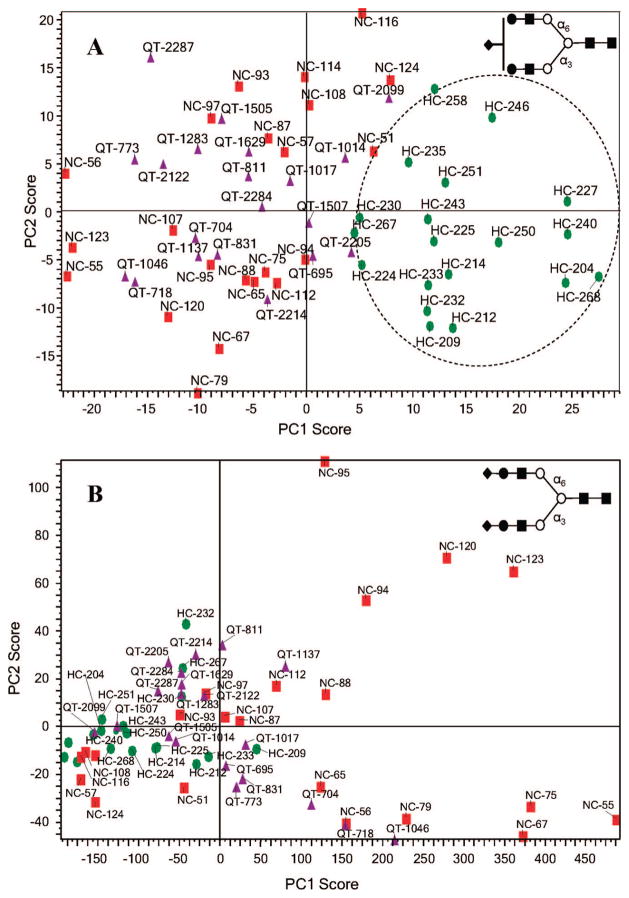
Figure 4.
(A) PCA of drift time profiles for glycan [S1H5N4 + 3Na]3+ (m/z = 826.0). (B) PCA of drift time profiles for glycan [S2H5N4 + 3Na]3+ (m/z = 946.7). Both analyses were done a total of 61 samples, that is, 19 glycan samples from serum of patients with liver cancer (HC samples, green circles), 22 glycan samples from healthy patients (NC-samples, red squares), and 21 glycan sample from patients with liver disease cirrhosis (QT-samples, purple triangles).

