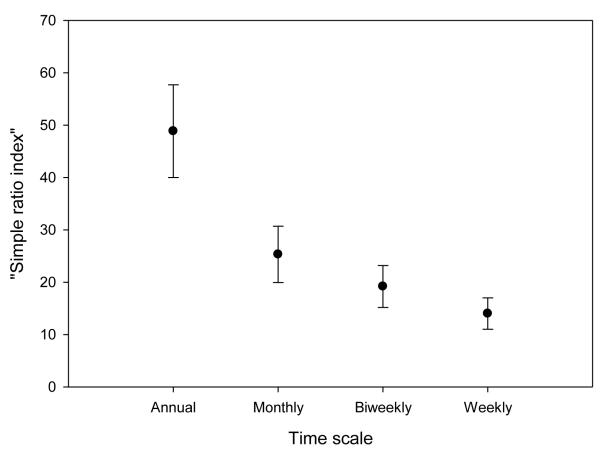
Fig. 1.
Variation in the percent time spent in overlap areas (using the “simple ratio index”) plotted as a function of whether space use was evaluated on an annual, monthly, biweekly, or weekly scale. Points and error bars represent mean ± SE; error reflects variability between pairs of groups. Data depicted were collected between 1 Nov 2008 and 31 Oct 2009 (the Amboseli hydrological year)

