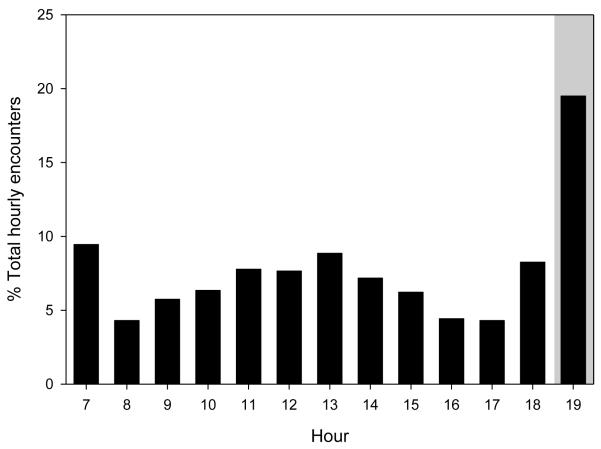
Fig. 3.
Hourly distribution of intergroup encounters; intergroup encounters were defined as occurring when pairs of groups were within of 250 m of each other (measured using GPS coordinate data). Shaded box indicates hours of the day when baboons are usually asleep; non-shaded area indicates hours of the day when baboons are active

