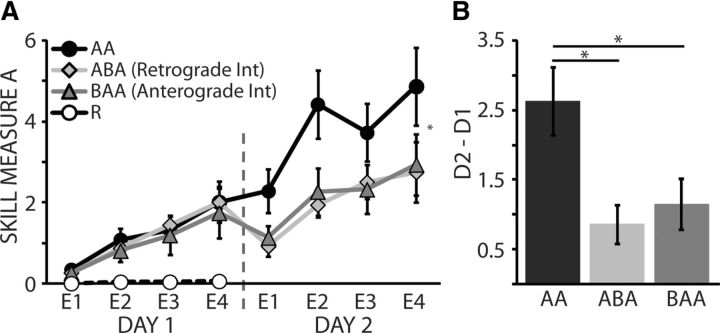
Figure 2.
Performance of Skill A. Black circles are the average performances of Skill A in the AA group, light gray diamonds represent Skill A in the ABA group, dark gray triangles are the Skill A performance average in the BAA group, and white circles are the skill performance average for the R group. Vertical dotted line denotes the separation between D1 and D2 of training. A, The y-axis represents the skill measure of A and the x-axis depicts epochs of training. Note that subjects who trained in the Group AA outperformed both interference groups (Group ABA and Group BAA) on D2 of training, whereas no significant differences in performance between groups were seen for D1. Group R showed no accumulation of learning. B, The bar graph shows group averages of Skill A measure on D2 relative to D1. Group AA was significantly better than ABA and BAA for D2–D1. Data are means ± SEM. *p ≤ 0.05.

