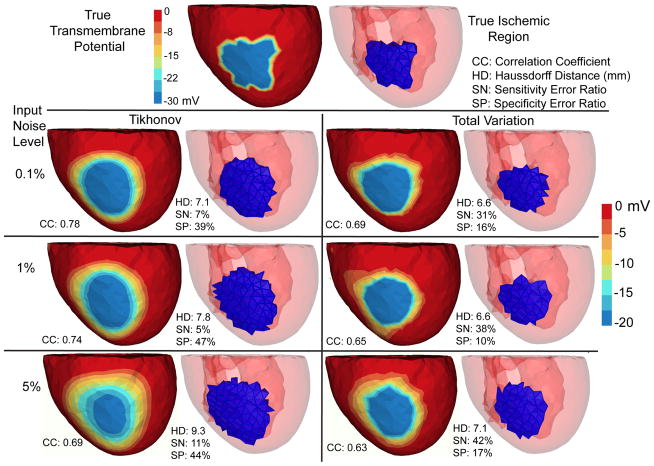
Fig. 2.
Inverse solutions based on Mesh 1 with synthetic ischemia data, obtained by the Tikhonov and the total variation methods. Ischemic regions are indicated by the blue color. All the calculated TMPs are in the same color scale. This figure is to be considered with Fig 4. The input noise is i.i.d. Gaussian imposed on each node on the body surface. The noise level indicates the noise-to-signal ratio in the root-mean-square sense. Such noise setting holds for all experiments in this paper.

