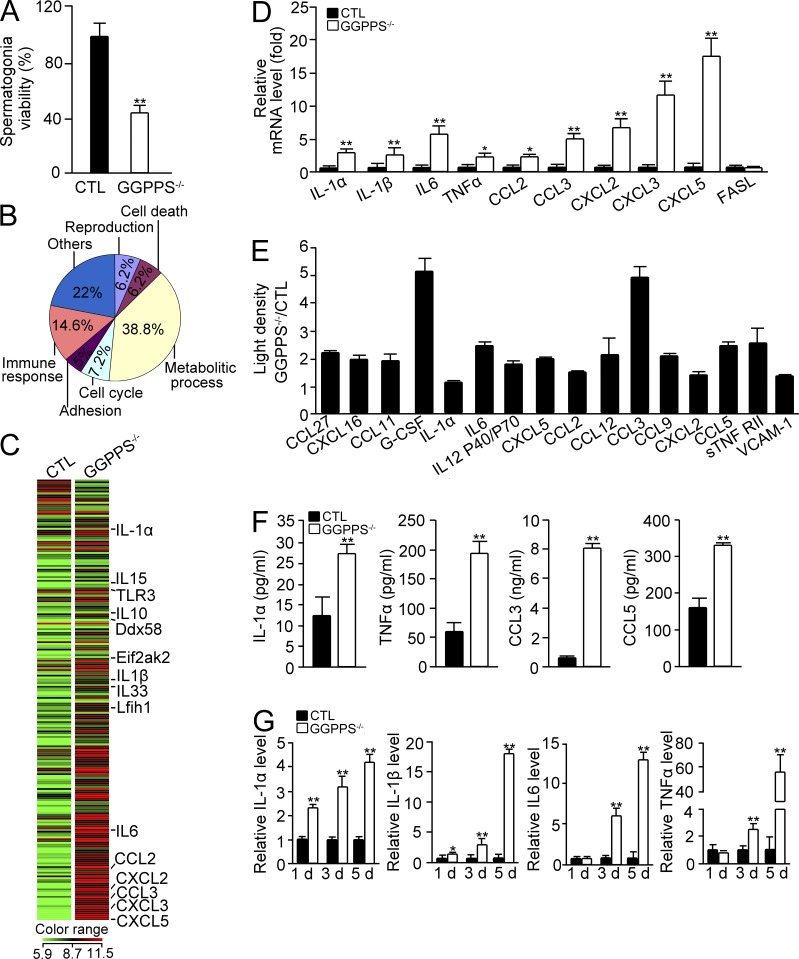
Figure 4.
GGPPS inactivation in Sertoli cells results in cytokine and chemokine release. (A) Conditioned medium from isolated GGPPS−/− Sertoli cells of third postnatal day testes was added to spermatogonia for viability after 24 h (**, P = 0.000428). (B) The gene expression profiles of primary GGPPS−/− Sertoli cells from third postnatal day testes. For each group, the RNA came from 30 mice. The expression of 1,623 distinct transcripts was changed between the groups. (C) The heat map of the gene expression of 239 cytokine and chemokine genes of Sc-GGPPS−/− and control mice. (D) qRT-PCR confirmation of selected genes from the gene expression profile in Sertoli cells from mice the third postnatal day (IL-1α, **, P = 0.000664; IL-1β, **, P = 0.000203; IL-6, **, P = 0.000203; TNF, *, P = 0.0446; CCL2, *, P = 0.012; CCL3, **, P = 4.64E-06, CXCL2, **, P = 0.000837; CXCL3, **, P = 3.66E-07; CXCL5, **, P = 0.000852). (E) The secretion of cytokines and chemokines from GGPPS−/− Sertoli cells from third postnatal day testes was analyzed using CytoArrays. (F) The secretion of cytokines and chemokines from GGPPS−/− Sertoli cells of third postnatal day testes was analyzed using ELISAs (IL-1α, **, P = 0.002543; TNF, **, P = 0.000744; CCL3, **, P = 3.4E-05; CCL5, **, P = 0.000402). (G) The expression of IL-1α, IL-1β, IL6, TNF, and FasL in Sertoli cells at different postnatal days (IL-1α, 1 d, **, P = 0.000885; 3 d, **, P = 8.37E-06; 5 d, **, P = 0.00065; IL-1β, 1 d, *, P = 0.033; 3 d, **, P = 0.00325; 5 d, **, P = 4.97E-06; IL-6, 3 d, **, P = 2.91E-05; 5 d, **, P = 5.15E-05; TNF, 3 d, **, P = 0.001581, 5 d, **, P = 0.001273). All of the groups of experimental animals contained a minimum of five mice. All of the data are representative of at least three replicates and are presented as the mean and SEM. *, P < 0.05, versus control; **, P < 0.005, versus control.

