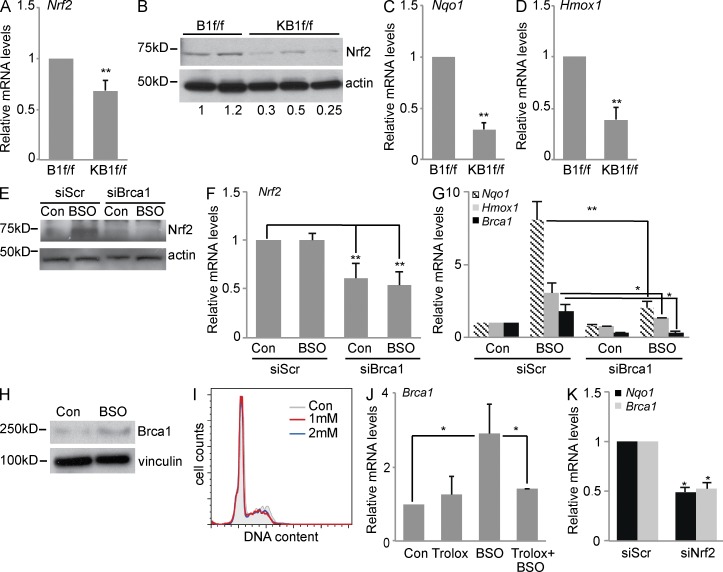
Figure 2.
Brca1 expression is regulated by oxidative stress and controls Nrf2 abundance and transactivation activity. (A) Nrf2 mRNA levels in B1f/f and KB1f/f pMECs. (B) Representative immunoblot of Nrf2 protein levels in pMECs from B1f/f (n = 2) and KB1f/f (n = 3) mice. Western blot quantitation is shown below. (C and D) RT-PCR analysis of Nrf2 targets, Nqo1 (C) and Hmox1 (D), in B1f/f and KB1f/f pMECs. (A, C, and D) Data are the mean ± SEM of n = 5 mice of each genotype. (E) Representative immunoblot of Nrf2 protein levels in control (Con) or BSO-treated COMMA-1D cells after transfection with scrambled siRNA (siScr) or Brca1-specific siRNA (siBrca1). (F) Nrf2 mRNA levels in cells treated as in E. (G) Expression levels of Nqo1, Hmox1, and Brca1 mRNAs in cells treated as in E. (H) Representative immunoblot of Brca1 protein levels in control and BSO-treated COMMA-1D cells. Vinculin was used as a loading control. (I) Representative cell cycle profile by PI staining of control or BSO (1 or 2 mM)-treated COMMA-1D cells. (J) Brca1 mRNA levels in COMMA-1D cells that have been left untreated (Con) or after treatment with Trolox, BSO, and Trolox plus BSO for 48 h. (K) Nqo1 and Brca1 mRNA expression in untreated COMMA-1D cells transfected with scrambled siRNA or Nrf2-specific siRNA (siNrf2). (F, G, J, and K) Data represent the mean ± SEM of three biological replicates. *, P < 0.05; **, P < 0.01.

