Figure 2.
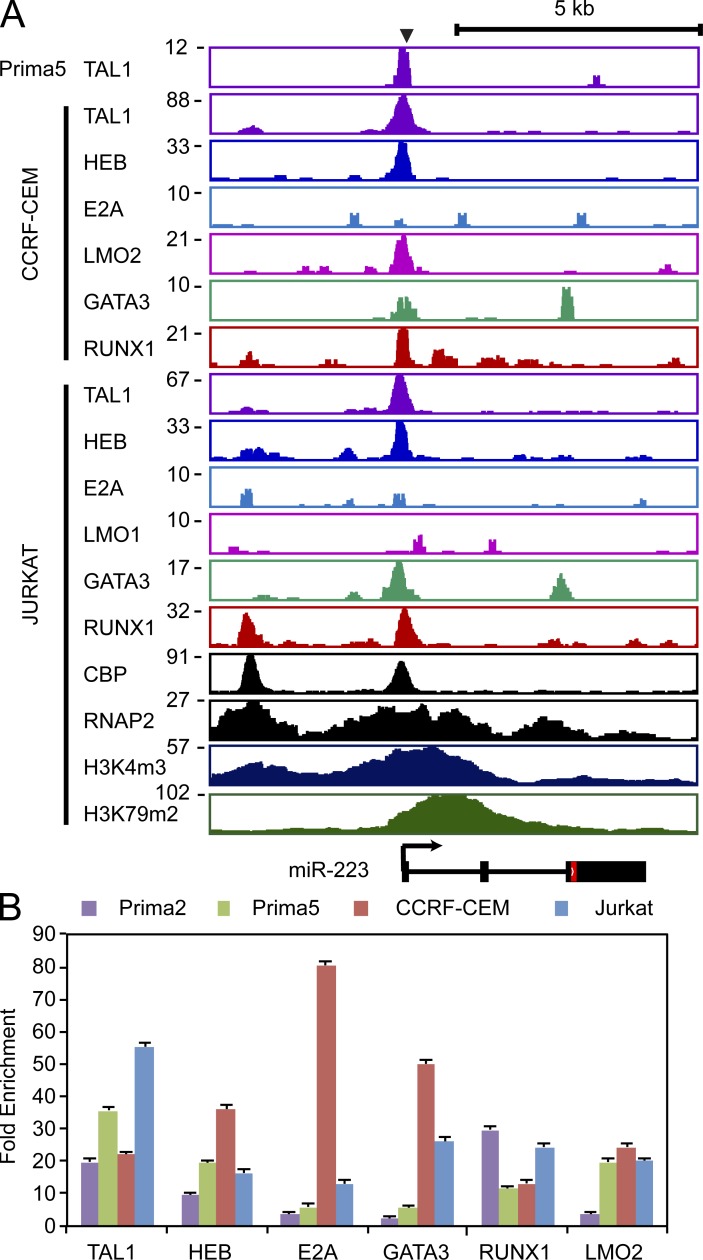
TAL1 and its partners HEB, E2A, LMO1/2, GATA3, and RUNX1 bind a region 4-kb upstream of the miR-223 transcriptional start site. (A) ChIP coupled to massively parallel DNA sequencing (ChIP-seq) was performed for TAL1, HEB, E2A, and LMO1 or LMO2, GATA3, and RUNX1 (Sanda et al., 2012). Gene tracks represent binding at the miR-223 locus in a human primagraft sample (Prima 5) and the T-ALL cell lines CCRF-CEM (top) and Jurkat (bottom), with the miR-223 locus shown below. Y-axis values represent the number of sequence reads. (B) Enrichment of miR-223 regions indicated in A in four T-ALL cell samples (Jurkat, CCRF-CEM, Prima 2, and Prima 5) was analyzed by ChIP-qPCR. Mean ± SD fold enrichment as normalized to binding at the NANOG promoter (negative control) is shown from two independent experiments performed in triplicate.

