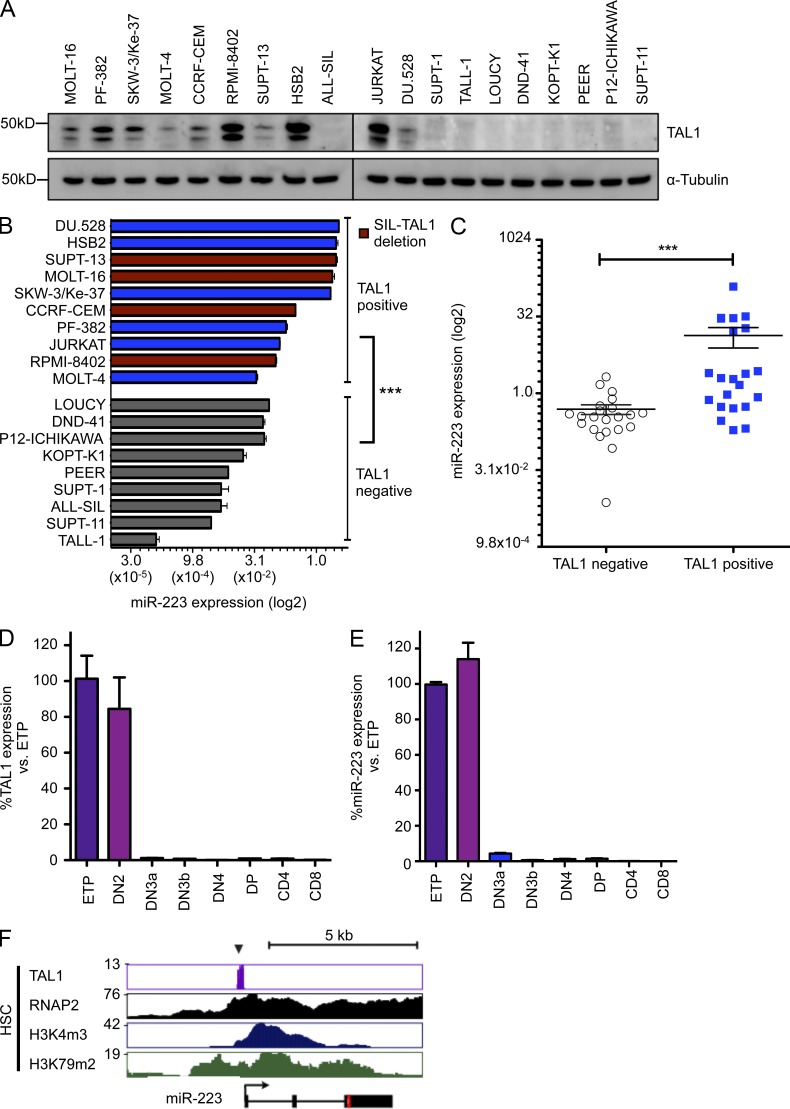
Figure 3.
TAL1 expression correlates with miR-223 expression in human T-ALL and during normal thymic development. (A) TAL1 protein expression as determined by Western blot in T-ALL cell lines. The double band is likely to reflect differing TAL1 isoforms. A representative blot from two independent experiments is shown. (B) Comparison of miR-223 expression as determined by qRT-PCR in T-ALL cells positive or negative for TAL1. Red bars indicate presence of an activating SIL-TAL1 deletion. Bars represent mean ± SEM from two independent experiments performed in triplicate. miR-223 expression is given as the percentage of RNU5A control. ***, P < 0.001 by two-tailed Student’s t test. (C) miR-223 expression as determined by qRT-PCR in 44 pediatric T-ALL patients according to TAL1 expression (n = 22 TAL1-positive; n = 22 TAL1-negative). Horizontal bars represent mean with SEM. TAL1 status was determined by qRT-PCR. miR-223 expression is given as the percentage of RNU5A control. ***, P < 0.001 by Mann-Whitney-Wilcoxon test. Expression levels of TAL1 (D) and miR-223 (E) as determined by qRT-PCR from thymic subsets sorted from mice (Pearson’s correlation, r = 0.89; P < 0.001). Bars represent the mean ± SEM of two experiments performed in triplicate. (F) Gene tracks showing binding of TAL1 in relation to the miR-223 locus in highly purified human hematopoietic stem cells. Binding of RNA polymerase II (RNAP2), together with H3K4m3 (marking transcriptional initiation) and H3K79m2 (marking transcriptional elongation) are also shown. Data are from Cui et al. (2009) and Novershtern et al. (2011).

