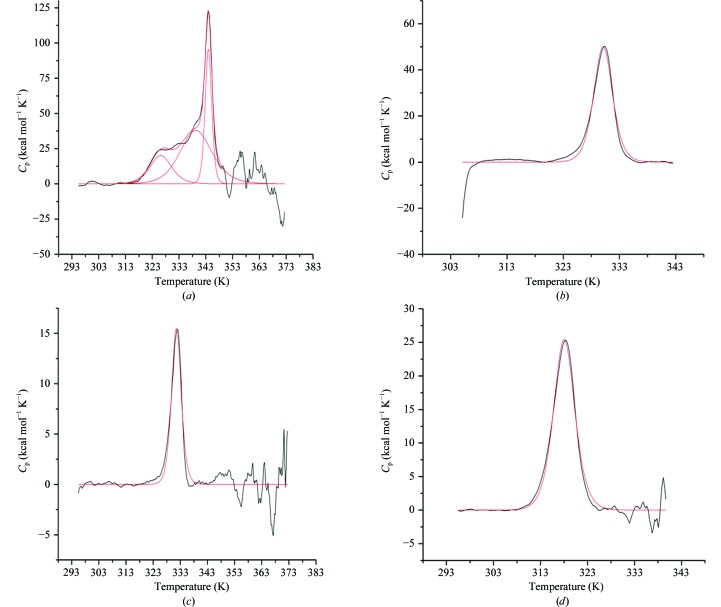
Figure 2.
DSC thermograms showing the specific heat as a function of temperature with the buffer-subtracted and baseline-corrected data shown in black and the fit to the curves shown in red. (a) dsHCAII at pH 7.8 showing three major peaks at 324, 339 and 344 K. (b) HCAII at pH 7.8 showing a single transition at 333 K. (c) dsHCAII at pH 5.6 showing a single transition at 333 K. (d) HCAII at pH 5.6 showing a single transition at 318 K.

