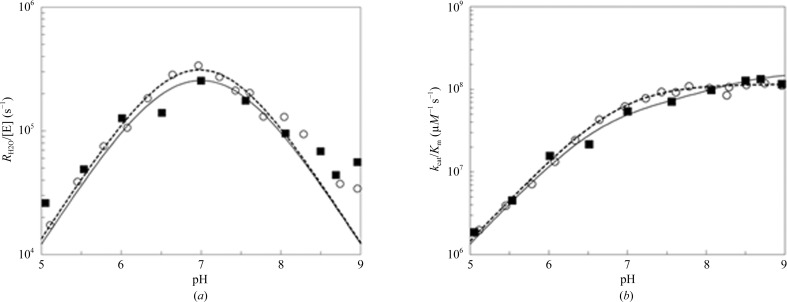
Figure 3.
Catalytic constants for dsHCAII and HCAII determined by 18O exchange. The results for dsHCAII are shown as solid black squares and those for HCAII are shown as open circles. (a) The pH profile for the rate constant  /[E]. (b) The pH profile of k
cat/K
m. Solutions contained 10 mM of all species of CO2 and 100 mM HEPES pH 7.6.

