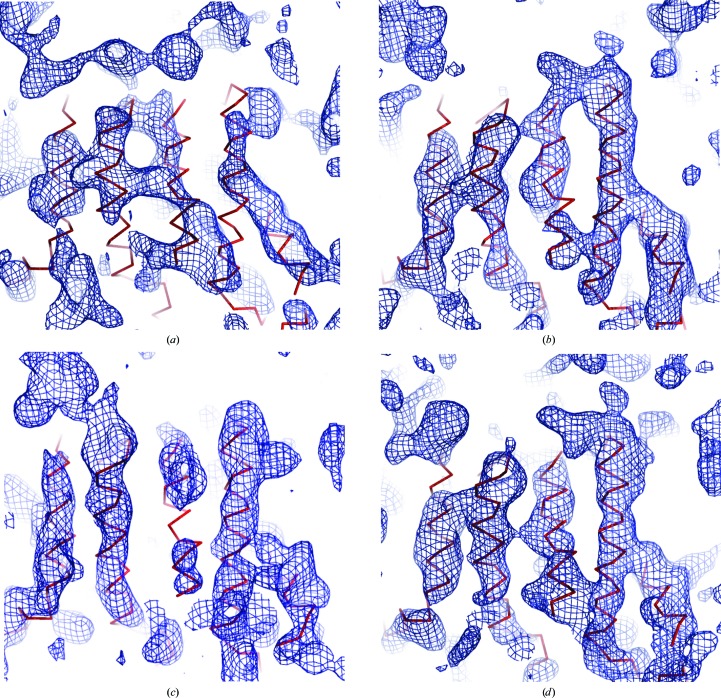
Figure 9.
Density maps for memPROT obtained with experimental phasing in autoSHARP (Vonrhein et al., 2007 ▶). The Cα-backbone trace of the final refined model is overlaid in red. (a) A34 is the best-quality data set corresponding to a full complete sweep. (b) cl015 and (c) cl18 result from the merging of multiple data sets collected at different positions of one and two crystals, respectively. (d) M1S14 results from the combination of all 15 data sets collected from crystal M1S14. The increased quality for the connectivity of multiple data-set maps compared with that of the individual data set is clearly displayed.

