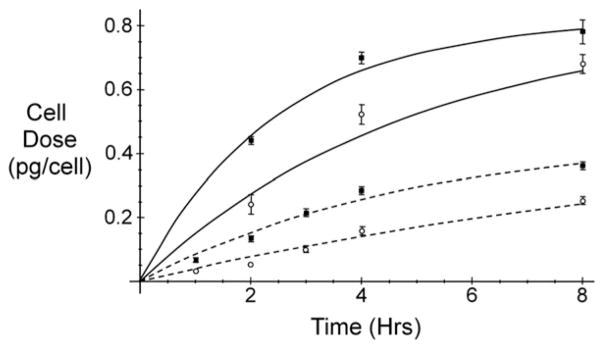
Fig. 3. In-vitro nanoparticle dosimetry.

Average cell doses for wildtype (■) and SR-A deficient macrophages (○) are shown with error bars that represent standard deviations from three replicates. Numerical fitting to Eq. (1) summarizes time-dependent results during exposure to either Ocean NanoTech (—) or in-house nanoparticles (— —) described in Table 1.
