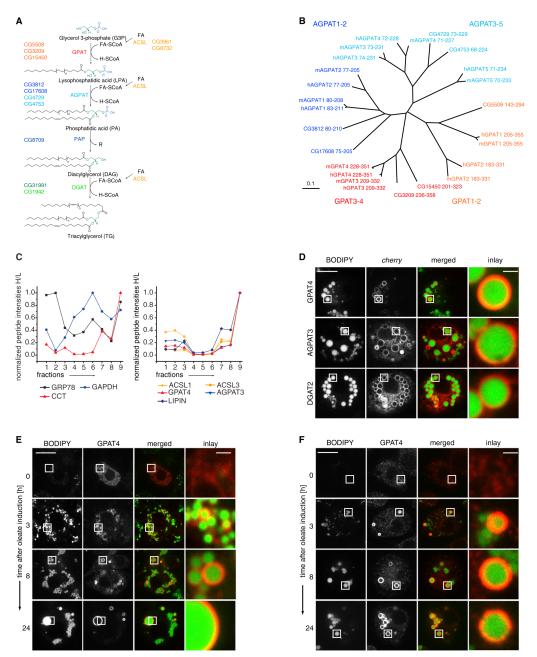
Figure 1. A Subset of TG Synthesis Isoenzymes Localizes to LDs in Drosophila S2 Cells.
(A) Overview of de novo TG synthesis. CG numbers identify the Drosophila genes encoding each activity.
(B) Neighbor-joining tree based on the degree of sequence similarity between acyltransferase domains of the GPAT/AGPAT family from Homo sapiens (h), Mus musculus (m), and Drosophila melanogaster (dm). The tree branch lengths are scaled in substitutions per site.
(C) Abundance profiles of proteins throughout the fractions of an LD purification measured by quantitative mass spectrometry. Normalized peptide abundances measured by proteomic analyses of fractions of a purification from cells metabolically labeled with heavy isotope-containing amino acids are shown normalized to an LD protein standard obtained by a similar purification. Fraction 9 is the LD fraction. The left graph indicates profiles representative of cytosolic (GAPDH), ER (GRP78), and LD (CCT1) proteins. The right graph shows profiles of isoenzymes involved in TG synthesis highly enriched in the LD fraction.
(D) GPAT4, AGPAT3, or DGAT2 tagged with fluorescent cherry tag (red) localizes to LDs (BODIPY, green) in oleate-loaded Drosophila S2 cells.
(E) GPAT4 accumulates at LDs during LD formation. Cherry-GPAT4 images during LD formation induced by oleate-containing medium at the indicated time points are shown.
(F) Immunofluorescence staining of GPAT4 (red) on forming LDs (BODIPY, green).
Scale bars, 10 μm (overview) and 1 μm (magnification). See also Figure S1, and Tables S1 and S2.

