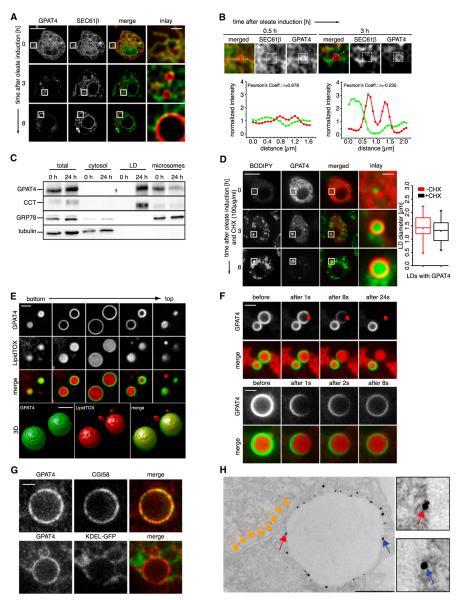
Figure 2. GPAT4 Relocalizes from the ER to the Surface of LDs.
(A) A time course of LD formation induced by oleate-containing medium shows segregation of cherry-tagged GPAT4 (red) from the ER marker (GFP-SEC61β; green). Optical sections focus on LDs, resulting in different sections of the nuclear envelope (NE) at each time point (plane of the NE at 0 hr; cross-section at other time points). Scale bars, 10 μm (overview) and 1 μm (magnification).
(B) GPAT4 tagged with fluorescent cherry tag (red) accumulates in specialized regions of the ER (marked by GFP-SEC61β; green). Scale bars, 10 μm (overview) and 1 μm (magnification). Intensity profiles of the two signals along the dotted line are shown. Pearson correlations for GFP-Sec61β and cherry-GPAT4 signal within the white boxes at 0.5 or 3 hr of oleate are shown.
(C) GPAT4 fractionates with LDs after oleate treatment. Western blots of equal protein amounts of cytosol, microsome, and LD fractions against the LD marker CCT1, the ER marker GRP78, and the cytosolic marker tubulin are shown.
(D) cherry-GPAT4 relocalizes to LDs from the ER during LD formation in cells where the synthesis of new proteins is blocked by cycloheximide added prior to oleate. On the right, sizes of 40 GPAT4-containing LDs from cells cultured 8 hr in control medium or medium containing cycloheximide are shown.
(E) Cherry-GPAT4 signal covers the entire LD. z sections and a 3D reconstruction of cherry-GPAT4 containing LD are shown. Scale bar, 2 μm.
(F) Cherry-GPAT4 decreases uniformly during continuous bleaching of a small LD surface section (upper panels). Cherry-GPAT4 recovers uniformly after photobleaching of a small LD surface section (lower panel). Scale bars, 2 μm.
(G) Endogenous GPAT4 (red) colocalizes with the LD marker CGI58 (green) but segregates from the ER (ss-GFP-KDEL; green). Scale bar, 1 μm.
(H) Silver-enhanced Immunogold staining of endogenous GPAT4 on LDs in thin-section EM. Red and blue arrows show representative gold particles on the surface of LDs. Yellow arrows show close-by ER structures. Scale bar, 500 nm.
See also Figures S2 and S3.

