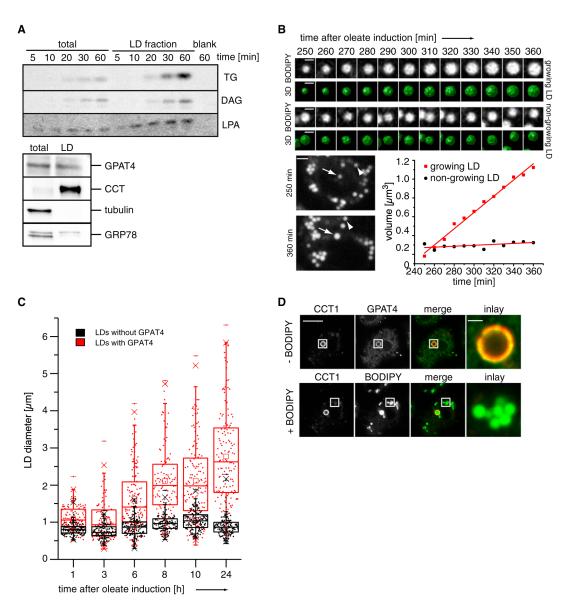
Figure 4. GPAT4 Localizes to Growing LDs.
(A) LDs are able to in vitro generate TG, DG, and LPA from radiolabeled oleoyl-CoA, resolved by TLC. Western blot analysis of the LD fractions (lower panel).
(B) A subset of LDs grows as shown by 3D time-lapse live-cell imaging from 0 to 8 hr of oleate loading. Representative optical midsections and reconstructions for a growing (top) and nongrowing (bottom) LD are shown from 240 to 360 min. Scale bars, 1 μm (BODIPY and 3D) and 2 μm (whole cell). The graph shows LD volume over time.
(C) Only LDs with GPAT4 expand over time. Scatterplots and box plots (median, lower and upper quartile, 1.5 interquartile range for whiskers) of diameters of LDs with (red) or without (black) GPAT4 are shown during their formation induced by oleate-containing medium.
(D) GPAT4 (green) localizes to expanding LDs marked by CCT1 (red) by immunofluorescence. After imaging the immunofluorescence signal, cells were stained with BODIPY to visualize all LDs (green channel). Scale bars, 10 μm (overview) and 1 μm (magnification).

